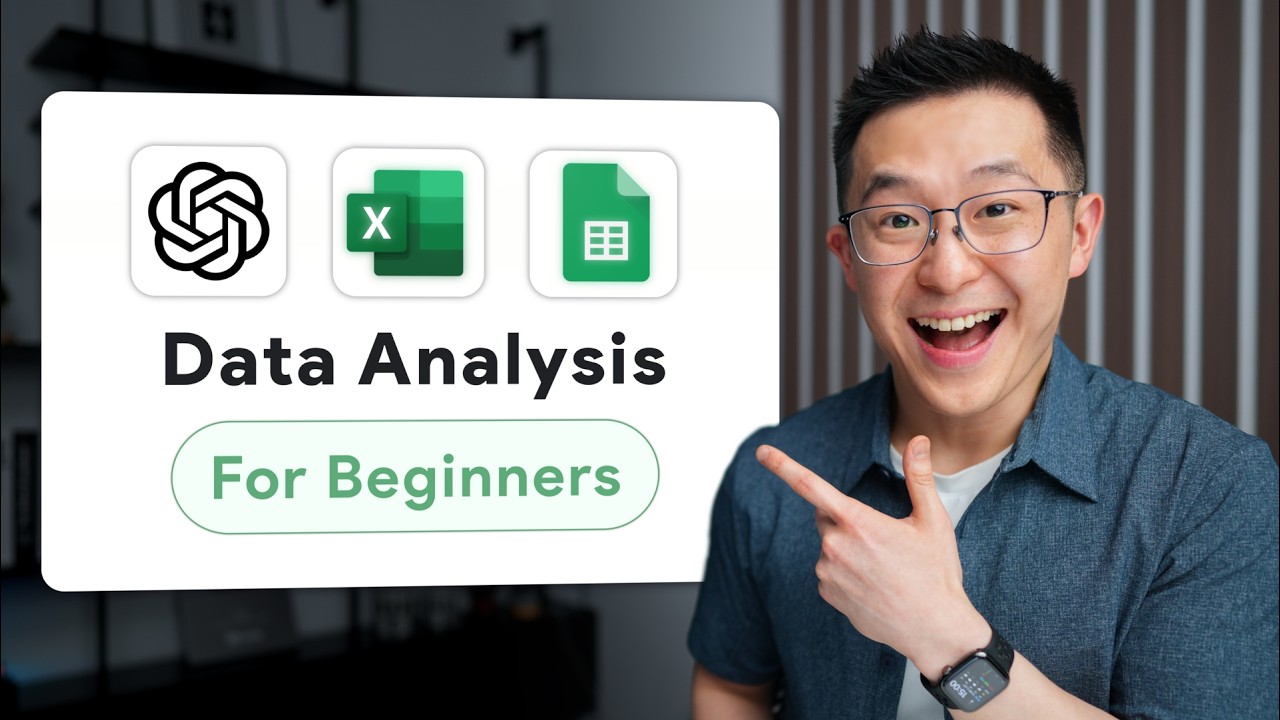
Master Data Analysis with ChatGPT (in just 12 minutes)
Machine-readable: Markdown · JSON API · Site index
Описание видео
➡️ Coursera Data Analysis course (40% off for 3 months): https://imp.i384100.net/c/2464514/3102764/14726
Learn how to analyze any dataset in minutes using #ChatGPT and the proven DIG framework. This practical guide shows you how to turn ChatGPT into your personal data analyst without any technical skills required.
Perfect for professionals who work with spreadsheets but lack formal data analysis training!
*TIMESTAMPS*
00:00 ChatGPT for Data Analysis
00:45 The DIG Data Analysis Framework
01:49 Step 1: Description
05:31 Step 2: Introspection
09:16 Step 3: Goal Setting
10:55 Bonus Prompt
*RESOURCES MENTIONED*
DIG Framework prompts: https://jeffsu.notion.site/184-data-analysis-resources
Apple TV+ sample dataset: https://jeffsu.notion.site/184-data-analysis-resources
https://www.jeffsu.org/newsletter/?utm_source=youtube&utm_medium=video&utm_campaign=184
ChatGPT Pro Tips video: https://youtu.be/p3840QxlYzc
*BUILD A POWERFUL WORKFLOW*
📈 The Workspace Academy - https://academy.jeffsu.org/workspace-academy?utm_source=youtube&utm_medium=video&utm_campaign=184
✍️ My Notion Command Center - https://www.pressplay.cc/link/s/DE1C4C50
*BE MY FRIEND:*
📧 Subscribe to my newsletter - https://www.jeffsu.org/newsletter/?utm_source=youtube&utm_medium=video&utm_campaign=description
📸 Instagram - https://instagram.com/j.sushie
🤝 LinkedIn - https://www.linkedin.com/in/jsu05/
*MY FAVORITE GEAR*
🎬 My YouTube Gear - https://www.jeffsu.org/yt-gear/
🎒 Everyday Carry - https://www.jeffsu.org/my-edc/
#dataanalysis