How to implement Linear Regression from scratch with Python
17:03

How to implement Linear Regression from scratch with Python

AssemblyAI 13.09.2022 86 967 просмотров 1 924 лайков

Machine-readable: Markdown · JSON API · Site index

Поделиться Telegram VK Бот
Транскрипт Скачать .md
Анализ с AI
Описание видео
In the second lesson of the Machine Learning from Scratch course, we will learn how to implement the Linear Regression algorithm. You can find the code here: https://github.com/AssemblyAI-Examples/Machine-Learning-From-Scratch Previous lesson: https://youtu.be/rTEtEy5o3X0 Next lesson: https://youtu.be/YYEJ_GUguHw Welcome to the Machine Learning from Scratch course by AssemblyAI. Thanks to libraries like Scikit-learn we can use most ML algorithms with a couple of lines of code. But knowing how these algorithms work inside is very important. Implementing them hands-on is a great way to achieve this. And mostly, they are easier than you’d think to implement. 
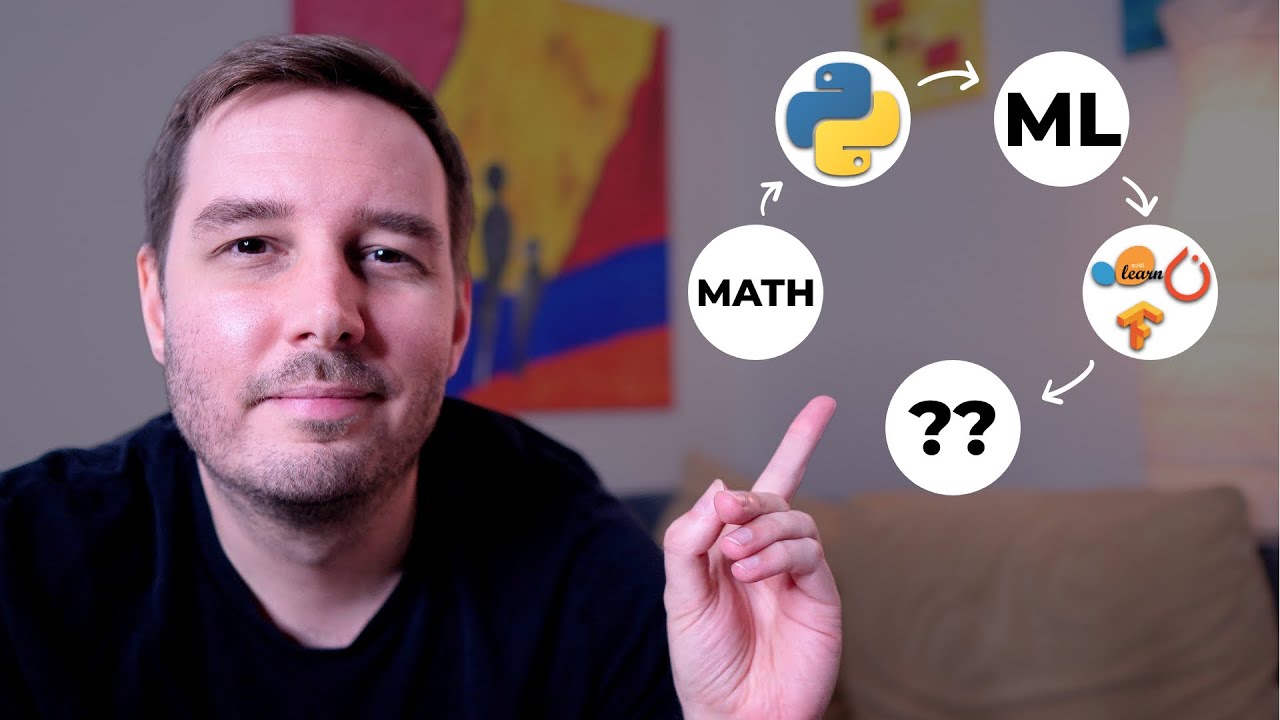
In this course, we will learn how to implement these 10 algorithms. We will quickly go through how the algorithms work and then implement them in Python using the help of NumPy. ▬▬▬▬▬▬▬▬▬▬▬▬ CONNECT ▬▬▬▬▬▬▬▬▬▬▬▬ 🖥️ Website: https://www.assemblyai.com/?utm_source=youtube&utm_medium=referral&utm_campaign=scratch02 🐦 Twitter: https://twitter.com/AssemblyAI 🦾 Discord: https://discord.gg/Cd8MyVJAXd ▶️ Subscribe: https://www.youtube.com/c/AssemblyAI?sub_confirmation=1 🔥 We're hiring! Check our open roles: https://www.assemblyai.com/careers ▬▬▬▬▬▬▬▬▬▬▬▬▬▬▬▬▬▬▬▬▬▬▬▬▬▬▬▬▬▬▬▬▬ #MachineLearning #DeepLearning

Оглавление (4 сегментов)

<Untitled Chapter 1>

the second algorithm that we want to focus on is linear regression so with

Estimation

linear regression what we're trying to do is to understand the pattern or the slope of a given data set and the assumption that we're making is that this data set has a linear pattern so here what we try to do is given this data set draw a linear line that fits this data as well as possible so you might probably remember this from your mathematics classes before what we try to do here is to calculate or estimate this equation that would give us a linear line that would fit this data the best to calculate the error of this line we use

Calculating Error

mean squared error and that is calculated as the actual value of a data point minus the estimated and then we get a square we do this for all the data points in our data set and then we divide this value by the number of data points in our data sets to find the best fitting line we need to find the values for the parameters of our model so weight and the bias that will give us the minimum mean squared error and to do that we need to calculate the derivative or the gradient of mean squared error and this is how it is calculated to do this optimization we use a technique called gradient descent so here in this graph

Gradient Descent

what you see is given a parameter value the error that is calculated so what we do with gradient descent is we calculate at a point where we have our parameter value which direction to go using the derivatives of the cost function uh to minimize the mean squared or error or generally the error of the model once we have this derivative we multiply it with a learning rate and then we subtract it from the weight or the bias so basically the parameter and that's how the parameters are updated but what is the learning rate so the learning rate tells us how fast or slow to go in the direction that gradient descent tells us to go so for example if your learning rate is too low it might cause a problem of you not achieving the minimum error because you're approaching it very slowly if your learning rate is too high you might keep jumping around in your airspace and you might never be able to find the minimum and that's why it's important to choose a good learning rate that will help us approach to the minimum error in a good time so to sum up what we do with linear regression is during training we initialize the weight and the bias as zero and then given a data point we predict the result or estimate the result with this given equation we calculate the error that this equation has this linear line has on our data set and then we use gradient descent and our learning rate to figure out what the weight and bias should be or how they should change and then we repeat it the number of times that was determined by the person who created this model and during testing again given a data point now that we have a model that is already trained we can already calculate the results using this equation some notes that will make it easier for us when we're implementing this algorithm is if you remember this was the derivatives or the gradients of the error function but there is a simplified version and here is the calculations you can try them out yourself if you like and this will be the version that we will implement because it's easier and also while we are implementing this model we're not going to go over the samples or the data points one by one we're going to put them in a matrix and we're going to do them all together all the calculations at the same time so this was our equation right to calculate the results but if we want to do it for all the data points at the same time then we can denote the x with a capital x and what it will look like is basically it will be a array of values x values and when we multiply this we'll take the dot product of this with the weight here's what we're going to have so basically an array of weight multiplied with the first value or the first data point and the second data point and for all data points and at the end the y pred predicted will look like this so when we're calculating the gradients it's actually going to make it a little bit easier for us because now we can get all the values of x all the data points transpose this matrix so that they're column and then we can multiply this or we can take the dot product of this with the y predicted but of course it's going to be the difference between the y predicted and the actual y and we can just calculate the derivative of the error function in terms of the weight but these are just some references to make it easier for us while we're coding this algorithm so let's get started all right so let's start the implementation of linear regression i'm going to again define it as a class and our in our initialization function we're going to have a bunch of things so first we need a learning rate just call it lr and i'm going to pass a default lr let's make this 0. 00 maybe for now of course i also need to pass a self here and then we need a number of iterations and this number of iterations can also have a default value let's say a thousand and then we as you know also have a weight and a bias i will define them as none for now but in our fit function that i'm going to write in a second we're going to initialize them as 0. as always we need a fit function and then we also need a predict function so the fit function we're going to use for the training predict function is for inference all right so let's press self here and the data set that we're gonna get from the user okay so let's remember how it worked here uh what we say is at first we initialize the weights as zero and initialize the bias as zero so let's do that get self weights so if we only have one parameter of one feature in this data set then we only have one weight of course but if you have more than one then we can have multiple weights so there is one weight for each feature so i need to create a zero array and it needs to be as many as a number of features so how can we get the number of features well we can use x dot shape of course and that is going to give me a number of the samples first and then the number of features all right so now i can use number of features to create the zero array for the weights and the bias is just going to be zero because it's just one value the next thing we need to do is predict the result by using this equation so let's do that but if you remember we said we are going to do it more effectively so let's go there yeah so when we're doing the predictions we don't want to predict uh for one sample at a time what we need to do what we want to do instead is to do the predictions for all samples at the same time so we have a array that corresponds to one prediction for each sample so how we can do that is basically we need to do um a dot product so we'll get the dot product of x with the weights as we see here plus the bias and this is going to give me the y print let's see what we're supposed to do next um what we said was uh we calculate the error use gradient descent to figure out the new weights and bias values and repeat this end time so we'll do the repeating in the last but we can do these two at the same time uh if you remember this is what we use to update the weights and the bias and for that we need to calculate the derivatives so the gradients and we know there is an easy way to do that and it's this one so we're going to use these equations so here again we have a dot product to calculate the gradient of the error function in terms of the weight and we just have a normal calculation for the bias gradient so let's start building that up too at wdw at first it's one over number of samples and we have that already and we're going to multiply this with the dot product of x again and the difference between y predicted and the actual y that we passed to this function uh y oh yeah it's white bread oh we have an imported numpy here so let's do that too numpy s mp all right the reason here that we're only doing the dot product and we are not doing the summation is because this dot product definition of numpy includes the summation so it basically gives us one number when you do this calculation here but if you want to learn more about that you can go check out the numpy documentation so let's do db again we need to do one over number of samples multiply by this time we need to sum it up the difference between the predictions and the actual values all right so now we have the gradients what we have to do is to update the weights and the bias so that was quite easy self weight we see here how do we update them is that we get the self weight again and we subtract self learning rate times dw and for the bias the same thing ah db this time all right so these are our updated values but we are going to train this model not only once if you do run it like this it's just going to run once and it will be done but we want to run it as many times as we have in our number of iterations so for that uh we're going to add a for loop here for something in range number of iterations we need to run this but as you can see we're not actually including this part because the initialization happens only once and then we're going to keep running this algorithm that we wrote here over the data set it needs to be self so once this is done it means that our model is trained already and then we can go ahead with the prediction so prediction is going to receive the self and another a new data set so let's see how we said we're going to do that uh inference time is given a data point put in the values from a data point into the equation which is quite easy okay we can just literally copy this and we get the dot product of the weights with the x and then add the bias to it and then we return the predictions and that's it actually now we have our linear regression class so let's try this on a data set and see how it performs so to test this linear regression that we just created the linear regression algorithm i'm going to make a regression using a scikit-learn's data set feature and let's see what this data set looks like on a plot okay so what we want to do is to fit it a line that fits quite well it's probably going to be like a diagonal line here and the number of features that we have is one so we're only going to have one weight but let's create the linear regression object um we have a default value so we don't really actually have to pass anything to it the reg and then i'll call rich fit x train y train and finally we get the predictions using reg predict with x test of course we also need to calculate the error on this calculated predictions the estimated predictions so let's define a mean squared error function predictions oops pass the y test to it and we pass the predictions so what we have to do is we get the difference between the y test and the predictions we get their square and we get the mean of this value oh yeah and that will be the error or let's call it mse and well we can just return this directly you don't have to pass it to a variable um all right so after we define this let's call it here and print this all right oh we got an error so let's see line 20. oh yeah i know what went wrong so here yeah we talked about this actually when we're thinking about doing it effectively here what we're doing is we are getting the dot product of the weights and the x values so this is correct but when we want to get the dot product of um to calculate the gradient what we have to do is we have to get the transpose of x and then do the dot product otherwise the dimensions don't work and that's what the error is telling us there is a dimension error so all i need to do actually here is just say get the transpose of x and now it should work linear object has no attribute weight linear regression okay that sounds fair because it's weights and not weight so let's go line 23 waits all right now it should work if i'm done with all the typos all right so yeah we do get a result our um msc our mean squared error is 783. so maybe we can put this in a graph so we can see it more clearly so i'll just create a figure using the predictions this is reg called predictions on this and then i'm creating a um graph that will show me the prediction line so let's do that all right so it looks like we are fitting somewhat well but not just well enough we ideally the line would be like this right so maybe i'll close this and maybe we can change the learning rate and that would make a difference so our default learning rate right now is 0. 001 so maybe if i make the learning rate a bit higher maybe a bit bigger maybe that will help let's try okay so that's much better our mean squared error is 305. 7 or that eight and this is what our graph looks like so it looks like we have a really nice linear line that really captures the slope of this data set so that's all from linear regression if you'd like this code you can go get it in our github repository the link is in the description if you have any questions leave a comment and we'll do our best to answer them but i will see you in the next lesson

Другие видео автора — AssemblyAI

Ctrl+V

Экстракт Знаний в Telegram

Экстракты и дистилляты из лучших YouTube-каналов — сразу после публикации.

Подписаться

Дайджест Экстрактов

Лучшие методички за неделю — каждый понедельник