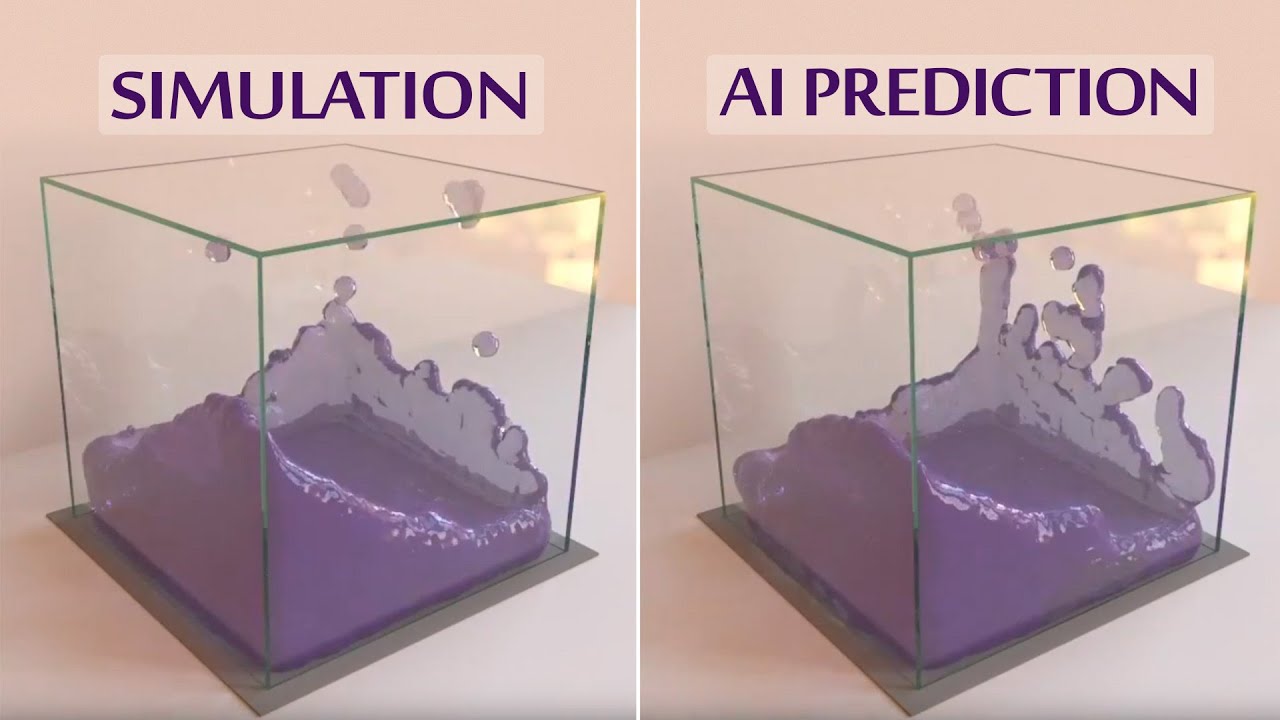
Simulating 800,000 Metric Tons of Ice! 🤯
Machine-readable: Markdown · JSON API · Site index
Описание видео
❤️ Check out Perceptilabs and sign up for a free demo here: https://www.perceptilabs.com/papers
📝 The paper "A glacier–ocean interaction model for tsunami genesis due to iceberg calving" is available here:
https://www.nature.com/articles/s43247-021-00179-7
🙏 We would like to thank our generous Patreon supporters who make Two Minute Papers possible:
Aleksandr Mashrabov, Alex Haro, Andrew Melnychuk, Angelos Evripiotis, Benji Rabhan, Bryan Learn, Christian Ahlin, Eric Haddad, Eric Martel, Gordon Child, Ivo Galic, Jace O'Brien, Javier Bustamante, John Le, Jonas, Kenneth Davis, Klaus Busse, Lorin Atzberger, Lukas Biewald, Matthew Allen Fisher, Mark Oates, Michael Albrecht, Nikhil Velpanur, Owen Campbell-Moore, Owen Skarpness, Rajarshi Nigam, Ramsey Elbasheer, Steef, Taras Bobrovytsky, Thomas Krcmar, Timothy Sum Hon Mun, Torsten Reil, Tybie Fitzhugh, Ueli Gallizzi.
If you wish to appear here or pick up other perks, click here: https://www.patreon.com/TwoMinutePapers
Thumbnail background image credit: https://pixabay.com/images/id-566722/
Thumbnail background design: Felícia Zsolnai-Fehér - http://felicia.hu
Meet and discuss your ideas with other Fellow Scholars on the Two Minute Papers Discord: https://discordapp.com/invite/hbcTJu2
Károly Zsolnai-Fehér's links:
Instagram: https://www.instagram.com/twominutepapers/
Twitter: https://twitter.com/twominutepapers
Web: https://cg.tuwien.ac.at/~zsolnai/