Cynthia Kase on Kase Bar Charting - Part 1
8:56

Cynthia Kase on Kase Bar Charting - Part 1

TraderInterviews 01.07.2010 4 536 просмотров 24 лайков

Machine-readable: Markdown · JSON API · Site index

Поделиться Telegram VK Бот
Транскрипт Скачать .md
Анализ с AI
Описание видео
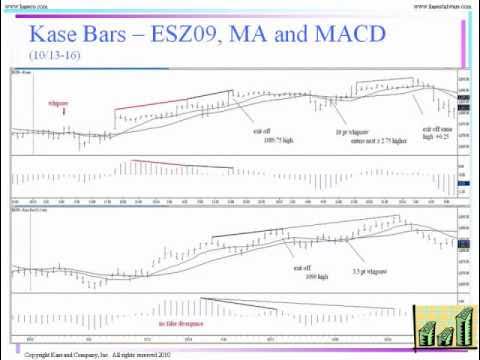
http://www.TraderInterviews.com. A new way to look at bar charts - accounting for volatility. Excellent view of technical analysis for short term trading strategies.

Оглавление (2 сегментов)

Segment 1 (00:00 - 05:00)

Hello everybody welcome back to Trader interview. com thanks very much for joining me for another show this week and today we're going to do something a little bit different I spoke with Cynthia case at the recent Traders Expo and took a look at some of her charts and the way she looks at the market so I wanted to get her on the phone today and talk to her about that and show you some of her slides as well so Cynthia thanks for joining me on the phone you're welcome well let's talk about uh kind of your overall approach to the market can you kind of describe your philosophy about trading investing well um my focus is always been more on the trading side uh I started out in the markets as an oil Trader and so uh my focus has been uh as opposed to selecting an instrument that looks good in uh developing uh techniques to trade a particular instrument uh of interest for example if one's a crude oil Trader uh you don't have the option to Trade corn If corn looks better than crude you have to trade crude oil if you're a wheat Trader uh working for uh a large uh food company for example you don't have the option to trade crude you have to trade wheat and so my focus has always been in very precisely trading a particular instrument of choice as opposed to what I call blunt instrument trading and that is uh uh trading a large portfolio cutting your losses and letting your profits run with very simplistic systems our approach has been to precisely enter precisely accit a particular uh commodity or issue okay so you're developing ways to look at the markets that would apply to any market then that's right okay and one of the things that I wanted to talk about right off the bat was case bars because you kind of developed a unique way of looking at bars in the market talk about that a little bit well you years ago back in the 80s uh I began to think about volatility and um how volatility is really the life and breath of the market and I began to think about the market three-dimensionally uh as a maybe a Taurus where uh in actuality the diameter so to speak of the market would expand and contract based on volatility so I thought of time charts as looking at let's say the diameter of the tourist uh expand and contract so for example um if in a given hour an hourly bar was a dollar High then the diameter was a dollar if the if the uh bar was $2 High the diameter was $2 and I began to think well you know is there a better way to look at the market rather than just time and I thought well why not normalize the market charts for volatility and look at bars with equal volatility so uh because volatility is kind of the underlying uh a measure of the market uh I thought it would be better to look at the market based on volatility and just to give you an idea volatility is proportional to the square root of time so I wanted to look at something that was directly proportional to the x-axis not proportional to the square root of the x-axis so very simply um what we decided to do was to look at the market based on a measure called average true range and um the first time I read about the average true range was in a book by wels Wilder new Concepts in technical trading which was published in the late 70s and so uh I decided to uh develop bars uh price bars that are equal average true range as opposed to um time on the x-axis all right so looking at the first slide that our viewers are watching in the video here the bottom right shows you on the left is kind of what regular bars would look like and then on the right side of that is what your bars look like because they're all the bars become the same size now that's right the tiex that make up uh make up the price action the actual transactions and prices reported that make up the price action are the same okay the prices are the prices however the way that the bars start and end on the left is dictated let's say by a 60 Minute bar five minute bar on the right it's dictated by the range of the particular bar okay how does this help you then see the markets more clearly before we go to a I have got a couple

Segment 2 (05:00 - 08:00)

of slides that show you that um just want to make the comment that on this slide is the uh formula for the true range if anybody is interested in that so going to the second slide we're on the case bars versus time bars now okay so if you look at the case bars versus time bars this is gold and you let's start out by looking at the right which is a standard 60-minute chart you can see that there are some very large bars going up uh some very small bar s chopping around and um and that uh during periods of sideways consolidation the market has become very choppy and very difficult to trade if you look on the left you can see much cleaner price action that whole choppy period at the beginning of the chart is condensed into a clean move up and a clean move down and then when the market starts to move up uh the choppiness at the beginning of the move it basically disappears and you just get a nice clean move up and then um a a clear correction down nice move up again and more clearly on the move down after the peak towards the right hand side of the chart if you look at gold you can see that there were a number of small bars and then the move down took place in basically one hour uh with another large move down the following hour where in the case bar chart uh the move is uh broken up into four or five bars of equal range and makes it much more easy to trade to enter the market to see the charts Etc all right so could I apply then a moving average or something else along any other indicator to case bars as well yes you can we're going to see an example of that in the slides shall we take a look at uh the natural gas chart where we have the candlesticks let's do that we're talking about the slide now case bars versus time bars engine yeah I wanted to specifically show uh the case bars with candlesticks because uh some people mistakenly think that case bars is a different type of bar in other words it's not an open high low closed bar or a Candlestick so the case bars is uh essentially uh equal range on the X AIS but the bars and the candlesticks display like an open high low closed bar or a Candlestick normally displays and here for example you can see that um there was a huge drop down in one hour and uh on the case bars that one big hour gets broken up into many different hours I think maybe six to seven excuse me six to seven bars and you can see the decline much more clearly and traded uh much more easily and then the sideways uh move that took place over night uh gets compressed into a couple of bars as opposed to uh the sideways small range action that we see overnight on the uh on the uh hourly uh candlesticks all right so because I have more bars I can start to see this decline more clearly than if I saw it just happen in one bar is that basically the essence of it well you can take advantage of it I mean certainly you can see it on the right but you can take advantage of it because you get a signal the indicators update after every bar right so rather than waiting until the move is over before you get a signal you'd get a signal somewhere uh after maybe the first or second bar down as opposed to uh waiting till the move is over and then you get the signal got it okay so if I'm trying to automate my system maybe I'll get a signal earlier than I would uh then if I just had it at the end of the bar yeah I mean regardless of whether it's automated or not I mean if you're using manual moving averages or stochastic or whatever you using uh you're going to get the signal sooner

Другие видео автора — TraderInterviews

Ctrl+V

Экстракт Знаний в Telegram

Экстракты и дистилляты из лучших YouTube-каналов — сразу после публикации.

Подписаться

Дайджест Экстрактов

Лучшие методички за неделю — каждый понедельник