My new trading course *special offer*
► https://tradeciety.com/course/
Do you like my free YouTube videos? Then you will love my new course!!
* no investment advice - informational and entertainment purposes only *
Our weekly trading newsletter:
► https://tradeciety.com/newsletter/
Our trading journal:
► https://edgewonk.com/
Trading podcast:
► https://tradeciety.com/podcast
####
Risk Disclaimer:
https://tradeciety.com/risk-disclaimer
Any and all liability for risks resulting from investment transactions or other asset dispositions carried out by the customer based on information received or market analysis is expressly excluded by Quantum Trade Solutions GmbH. All the information made available here is generally provided to serve as an example only, without obligation and without specific recommendations for action. It does not constitute and cannot replace investment advice. We, therefore, recommend that you contact your personal financial advisor before carrying out specific transactions and investments.
In view of the high risks, you should only carry out such transactions if you understand the nature of the contracts (and contractual relationships) you are entering into and if you are able to fully assess the extent of your risk potential. Trading with futures, options, forex, CFDs, stocks, cryptocurrencies and similar financial instruments is not suitable for many people. You should carefully consider whether trading is appropriate for you based on your experience, your objectives, your financial situation and other relevant circumstances.
Information and Opinions: Information on this site is provided solely for informational or general educational purposes and should not be construed as an offer to sell or the solicitation of an offer to buy securities or to provide investment advice. The opinions and analyses included herein are based on sources believed to be reliable, but no representation or warranty, express or implied is made as to their accuracy, completeness, timeliness, or correctness. All information contained herein should be verified independently.
Results: Past performance is not necessarily indicative of future results. Investment information may not be appropriate for all investors. HYPOTHETICAL PERFORMANCE RESULTS HAVE MANY INHERENT LIMITATIONS, SOME OF WHICH ARE DESCRIBED BELOW. NO REPRESENTATION IS BEING MADE THAT ANY ACCOUNT WILL OR IS LIKELY TO ACHIEVE PROFITS OR LOSSES SIMILAR TO THOSE SHOWN. IN FACT, THERE ARE FREQUENTLY SHARP DIFFERENCES BETWEEN HYPOTHETICAL PERFORMANCE RESULTS AND THE ACTUAL RESULTS SUBSEQUENTLY ACHIEVED BY ANY PARTICULAR TRADING PROGRAM.
#forex #trading #technicalanalysis
Оглавление (5 сегментов)
Segment 1 (00:00 - 05:00)
Today I have a very special support and resistance trading tutorial for you. In this video we are going to learn what support resistance is, why it's so important that you know about those concepts. We are also going to explore the different support resistance types, which are static, dynamic and psychological. I will show you exactly how to use them and how to draw them. I have included several different support resistance strategies and we're going to cover the most commonly made and how to fix them. So when we now dive into the charts, we will see that there are different types of support resistance. Most commonly used are static support resistance. Those are the your hand drawn levels that you directly draw on your charts. Typically those are the horizontal levels, but we also have trend line based support resistance, which are diagonal levels. We have dynamic support resistance types. Those are support resistance levels that change all the time, but they are done in an very objective manner. So moving averages are often used as support resistance as we will see. Pivot points are very commonly used. Daily highs and lows and a few others. And we have psychological support resistance types. Those are round numbers which work exceptionally well. Also monthly and annual highs and lows. Those are levels that you often see that media, TV, big blogs and other social media posts are often referring to those really long-term high impact levels. So let's discuss how we draw levels. Our video resumes in 15 seconds and I just want to let you know that my new course is now available. This is the course that I wish I had when I started trading 16 years ago. The course comes with 100 brand new videos. There are many new strategies with hundreds and hundreds of chart studies. It works on all time frames and all markets. And the link to that course with a special promo offer is in the video description below. We're starting with hand drawn levels and here we have a recent chart where we just drew horizontal levels around some swing points, but there's a big problem and they are very subjective. You can draw them anywhere and there's no real rule to that. Of course, the question always comes up, do you use wicks? Do you use the bodies? Is it okay to cut through the wicks? How do you draw support resistance levels? And there's a very easy and simple fix that will make your support resistance zones way more accurate and way more impactful. What I would recommend is that after you have drawn them around, let's assume you've drawn them around highs, you switch to a line graph and the line graph will only give you the closes and you can already see that when we switch to the closes, the levels don't really add up and they don't really align that well. So what we then do is that on the line graph, we are only drawing the support resistance on the absolute closes. You can see that here. All red levels and red lines are the new ones that we draw around important swing points. So here, the first one, here, here. What we then have is the black hand drawn level and the red line graph level. We just simply fill those zones up with a rectangle bar and you can already see that now it captures the price action much nicer. You have a little bit more objectivity in your levels and this is one of the biggest recommendations that I can give to you. If you're using hand drawn levels, use zones instead of just single lines. A lot of traders will have a lot of problems if they use just single lines and then they will find out that there's a lot of noise. Price overshoots those zones or the levels. Price sometimes doesn't reach them and come close to them and this will fix a lot of those problems. So when it comes to drawing levels, this is a very big recommendation. When we come to moving average, for example, they do work really well and they have been around for decades and decades. My biggest tip when it comes to using moving average is that you stick to the most popular ones. The concept of the self-fulfilling prophecy is very big in trading and very big in technical analysis. You can generally say that the more the people use a specific tool, the better the price will react. So what I would recommend is that stick to the popular ones. 20 EMA or SMA, the 50 100. You will often see if you're using the daily, the 250, the 300. Don't come up with your exotic own creations of an EMA setting or period. Stick to the ones that are popular, that everybody is using. And keep in mind moving averages are
Segment 2 (05:00 - 10:00)
trend tools. Moving averages only work in a trending market. So you can see here, the market is in a range and the market just trades around the moving average. So as a support resistance tool, it doesn't really work, but as soon as the market starts trending here, you can see that the bounces often occur around moving averages. One of the dynamic tools is the daily high and low. This is a tool that I've been using for probably 10 years now and in the beginning of my trading I always used hand drawn support resistance levels. I still use them to some degree as I will show you later when we come to the support and resistance strategies, but switching and adding the high daily high and low is a real game changer to your trading. So in TradingView, you just search for the indicator. It's called previous day high and low and then it will just give you this channel. The green line is the previous day. The red low. And what you will often see is that in X really well as support resistance. When you're in a trending move, the market often ends its trends around the previous day high and low and those are really great tools to have on your charts. Trend lines, although they are popular, I would generally discourage you from using them. They are extremely subjective. Whereas horizontal levels still also are subjective, they are only drawn, they can only be drawn in so many ways, right? Typically you draw them around a high. You typically use the peak of a candlestick, but trend lines, you can draw them 360 degrees. So there are endless ways on how you can draw them and that's why a lot of traders have issues using trend lines because they're just so subjective. If you're using trend lines and I will show you later how to do that, always combine trend lines with other concepts. I will show you that when we come to the trading strategy part, but trend lines on their own, I don't think they are really that valuable and a lot of traders are struggling using them. Pivot points are amazing tools, especially the standard pivot points. So when you pull up your pivot point indicator, you will generally see that one is called P. This is the standard pivot point zone or level rather. And in a trend following market and in a trending market, they are amazing. So you can see those are the daily pivot points and you can see the market moves higher, pulls back, moves higher, pulls back and those are really great trend following tools. They help you spot support resistance. If you're trading long-term charts, the weekly pivot points can also be amazing, but on a trending chart, they are really great as trend filters, but also when it comes to just finding pullbacks. And then we have round numbers. Round numbers are really amazing and you will see that some markets pay really close attention to their round numbers. So for example, crypto. This is a recent Bitcoin chart and the blue and the green dotted lines, they are round numbers and you can see how amazing the price is really reacting to those round numbers. Some markets are way more inclined to follow their round numbers and on some markets, the round numbers really act as amazing support resistance. Something went wrong here with the arrows, but I think you get the point. You can see it already how well they are working. Other markets, they don't really follow their round numbers and round numbers are not so important to other markets. So depending on what market you trade, add the round number indicator to your chart or draw them manually and observe how your market is following your round numbers. And of course, a little bit of an exotic one, but this is also something a lot of traders use, volume profile. So here's the visible range volume profile and what you can do is you find a high volume node, so where the volume really peaks and you will often see that obviously this means that the most trading activity has taken place around those areas. So you'll typically see that there's a lot of action around those areas. You can see that here really nicely and this is also how you can start using volume for support resistance to have a little bit more of an objective approach. So another really great way. And let's take a look at how we actually use support resistance in trading strategies. If you like my YouTube videos, you will absolutely love my new trading course. The new course takes my trading videos to a whole another level. I've recorded over 100 brand new videos. I have included new strategies with exact rules and hundreds of
Segment 3 (10:00 - 15:00)
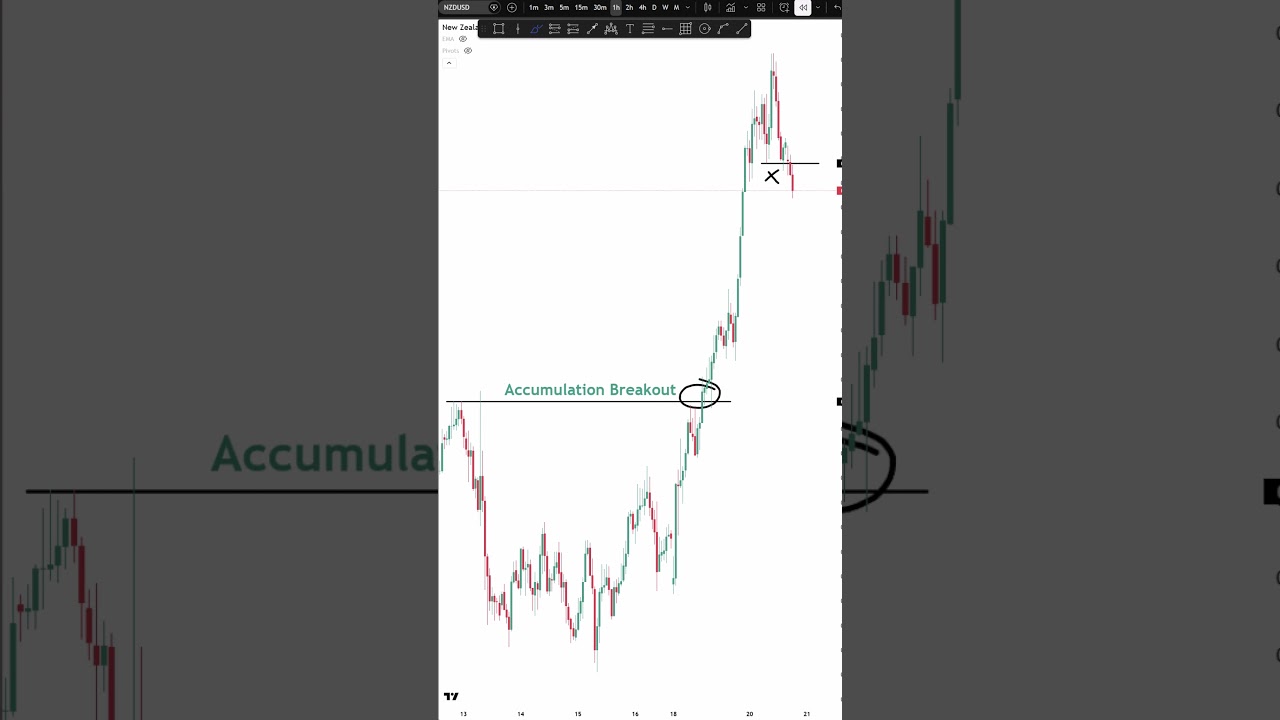
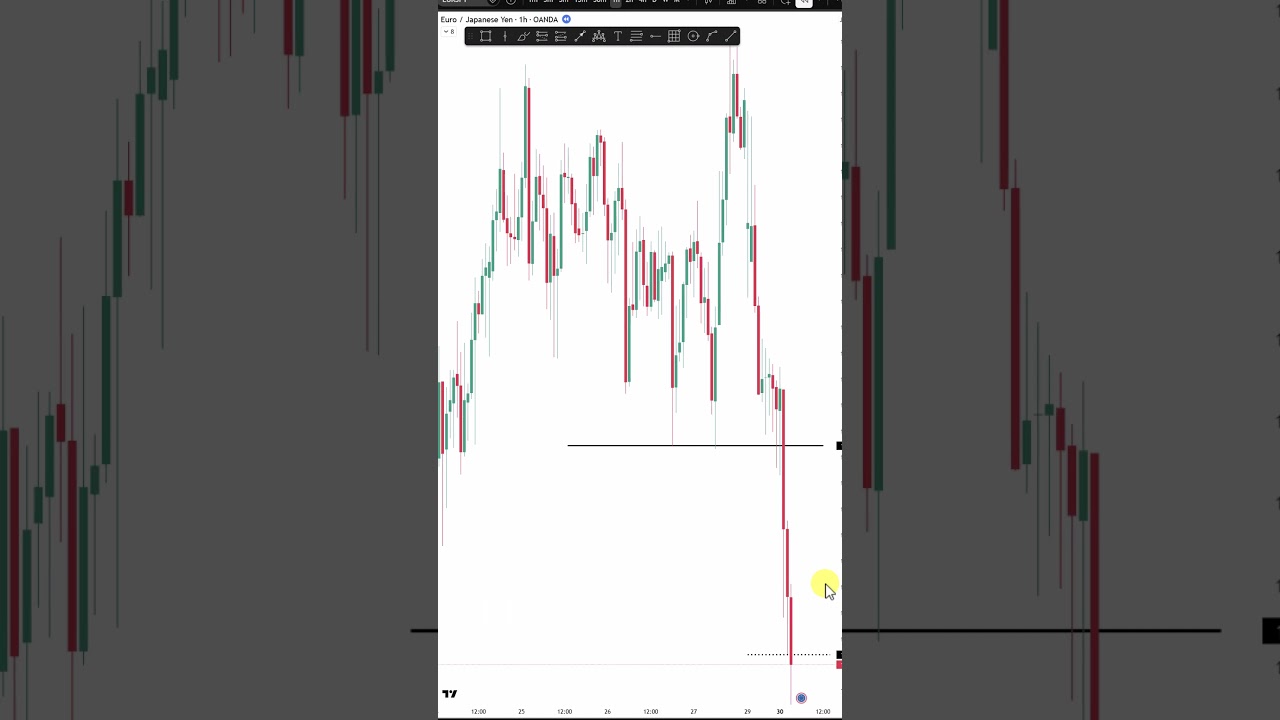
screenshots. The material works on all time frames and all markets. Of course, I also cover risk management, position sizing, strategy development, strategy improvement, trading psychology, and so much more. The link is in the video description, and we currently have a very special promo waiting for you. So, let's take a look at how we integrate the multi-time frame approach here for support and resistance. I would always recommend start on a higher time frame. For example, here we have a 4-hour time frame, and if you want to trade support and resistance or find your signals on a lower time frame, always advisable to start on a higher time frame. So, we draw here at a key turning point um outer liquidity or outer support resistance, no matter how you call it. We draw the big levels, the big turning points. That's what we want to focus on. Then, it's simply a matter of waiting. We wait until the market is reaching back into the level. Really important here, just because the market is touching a level, it doesn't mean you should automatically jump into a trade. That's what a lot of traders get wrong, and that's why their results are so poor. Um don't trade levels blindly. Wait for the price to get there, and then you go to the lower time frame, and you start observing your price action. You want to see is there a setup? Is there an entry being created? Not every time when the market is touching such an high-impact level, there's also be a trading opportunity. Sometimes the market will not do anything, give you a signal that you can't read, but every now and then you will get an opportunity. So, we are going to stalk this setup, and we're level. And you can see afterwards we have a break and a retest of this short-term support that turns into resistance. The break and retest has been confirmed when the market is pushing into a new low here. That's where we then initiate our short opportunity or short signal, and then you can see the market trades away. So, the traders who entered right at the level, you can see you have to sit through a lot of back and forth. Probably a lot of traders will realize a lot of small losses when the market is trading around it. So, you always want to make sure that there is a real reaction with a real signal with an objective pattern that you can then trade. Another great way of using support and resistance is by using the fake out. So, here we have a long-term level around swing points here, and the market has come back into this level multiple times, and we really want to observe how the market is reacting. As I've said in other videos in the past, I'm not a very big fan of trading simple breakouts. So, just because the market has pushed above a level, it doesn't mean you should automatically jump into it. Um what I would like to do is always observe the next candle. What is the next candle doing? retesting the lows here? Uh is it turning resistance into support? In this case, you can see the market is immediately capitulating. The market is failing right away, and this is then a confirmed breakout. Really, really strong signal where the market has tried to break out above this level multiple times. Every time the market was rejected, and this is then often what is causing a complete reversal into the opposite direction. Once again, we have our break and retest. Um we are using short-term support, right? We have a short-term support level where we have one, two, three touch points. The market breaks below it, retested from underneath, and this is then where you create your short signal. Let's take a look at a pattern. And what is really important to understand um is that support and resistance is at the core of pretty much every chart pattern that you trade. Of course, it's not always a long-term level where you draw your level at a significant peak, and then you wait for the market days or weeks to come back to it. Sometimes it's just short-term support and resistance. Nevertheless, it is a form of um support resistance. So, the market is in an uptrend, it trades around the level, trades lower, comes back to back. Then here, the market sells off um not a lot. This is then what we call something like a cup and handle pattern, where the market is coming back to the level sooner and sooner. You always want to combine this with a higher time frame. So, ideally you check the higher time frame to see is this in a long-term trend. Again, you want to ask yourself how strong is the price moving away from a level? How fast is the price coming back to a level? Just those two questions alone will help you understand charts and price action in a much better way. Here, we have then the breakout. This is the initial breakout candle. As I said in the example before, we never want to trade the initial breakout. You always want to wait at least a candle to see is the market failing or is it pushing away? In this example, the market is not pushing back into the zone. It is staying above it, and then um the uptrend is continued. Let's see how we can combine long-term
Segment 4 (15:00 - 20:00)
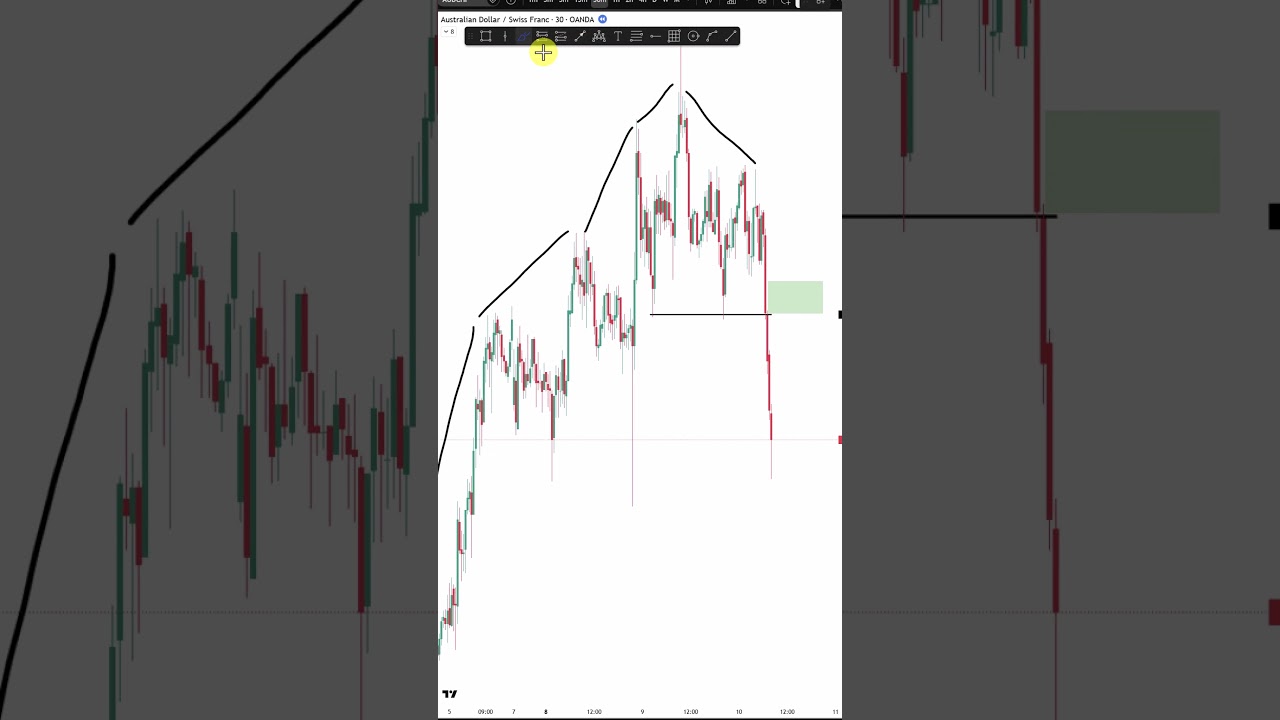
and short-term support and resistance. So, here what we're looking at is an inverse head and shoulder. We have the left shoulder, the head, and the right shoulder. Here is a short-term support and resistance level, and we have the breakout. By looking at this chart, we can see that we are trading against the downtrend. That's not ideal because the market has been going down, and ideally we want to look for continuations to the downside. We don't necessarily want to trade reversals because reversals way more likely are failing. So, we want to zoom out. We want to see does this pattern make sense in the bigger picture? And in this case, it does, right? We have a resistance level that then turned into support. The market reacted to it twice, and now the market is reacting to it once again. So, we have a lot of confirmation. We have a very big round number, 23 at this area as well, where the market is um finding support. And in this case, um the pattern makes sense. The location of the pattern makes a lot of sense. So, this is a very good filter that you can apply in your trading. Only trade patterns when they make sense on a chart context. First of all, you want to make sure that you are trading in the right trend direction, and you also want to make sure that your pattern has some other confluence like location here. Where is the pattern occurring? And then on the lower time frame, you can see the market broke out. It even retested short-term support level as resistance, and then took off. So, we have a long-term resistance turning into support, and we have short-term resistance turning into support. Really cool concepts, and this is a good example of how you can stack levels and confluences. Let's take a look at supply and demand. Supply and demand is also a way of finding support and resistance. Although they are not the same, as the name suggests, supply and demand also gives you a way of finding good trade locations. So, here we on this downtrend, it created this liquidity void, which just simply means that there's a strong sequence of selling without any bullish buying in between. And then at the origin of this huge drop, you are finding here your supply zone. We simply draw it in, and then we wait for the market to come back to the zone. We don't automatically get in because there is a supply zone. We want to see um that there's more confluence. So, we go to a lower time frame now. We go from the 2-hour to the 1-hour, and again we see that there is a pattern building. We have a head and shoulders pattern. We have a short-term support level. We have our breakpoint defined, so that's where we want to get into a trade. We wait another candle. We don't jump blindly onto the first breakout, and then you can see the market really took off. So, another way of how you can combine short-term, long-term. We have patterns, we have supply and demand, and that is then how you build more robust systems. Let's take a look at trend lines. Um trend lines are typically drawn by just connecting the highs in a downtrend. There is at least one very special video on this YouTube channel where I have a complete trend line course. You can just search it on my YouTube channel. Um but here what we have is a downtrending trend line. The market is breaking the trend line here. What I always do is I look for more than just a trend line on my charts. Here once again, we have a short-term support level that was then also broken. We see that we have a double top, and we see that the market has now its first bullish momentum. Um again, just because a trend line is broken, I would not necessarily say you should jump on a trade. Also, it's against the downtrend that you have here, not ideal as well to go against an ongoing trend. So, what we do instead is we wait for the market to touch the zone. The support turns into resistance, turns into support once again. We can also add here a moving average to our charts. The moving averages hold up nicely here, act as some good additional confluence. And now you have a lot going in your favor, right? We have the trend line, we have the level, we have the moving average, we have the retest, and we have the acceleration here. So, this is a multi-faceted trade, not just a single signal. And that is a big problem that many traders have. Let's look at a few other mistakes that a lot of traders make when it comes to support and resistance. The biggest one I think in my experience is that they draw too many levels. This is something that a lot of new traders are struggling uh with. So, they overload their charts, and then this creates paralysis by analysis, which means that have so many things going on your charts, you don't really know what to do. You're fearful, you're worried that the price is going to bounce at every little level, so you end up doing nothing and you miss opportunities. Missed
Segment 5 (20:00 - 21:00)
opportunities creates a lot of FOMO in the future where you jump into bad opportunities. It's just a very, very bad way of trading. As I said in the beginning, you should never treat support and resistance are exact lines, instead use zones. Support and resistance is never a single line. Price action is very dynamic. There's a lot of noise going on. Um so, always try to work with zones instead of levels. Also, a big mistake a lot of traders make is that they ignore the higher time frame. You should always start your analysis on the higher time frame. The higher time frame levels and price action, the trend direction, the patterns that you see have way more weight. They are way more important than your lower time frame um price action. So, always start your analysis on the higher time frame. Always draw your levels or your zones on the higher time frame. Another big mistake that a lot of traders make is that they're not waiting for confirmation. What I see a lot is that traders draw a level and then as soon as the price gets there, they jump into a trade. This often leads to very bad trades. It's not a very robust way of trading, especially if you then also use um very subjective tools, hand-drawn levels, single lines. Always wait for more confirmation around a level, which is immediately also tied in into the last point, using support and resistance in isolation. You should always combine your support and resistance with other trading concepts, patterns, higher time frame um support and resistance, break and retest, whatever it is, add more than just single um support and resistance to your trading strategy, and that will typically wait make it way more robust and give you more uh anchor points and just more confidence in your analysis.