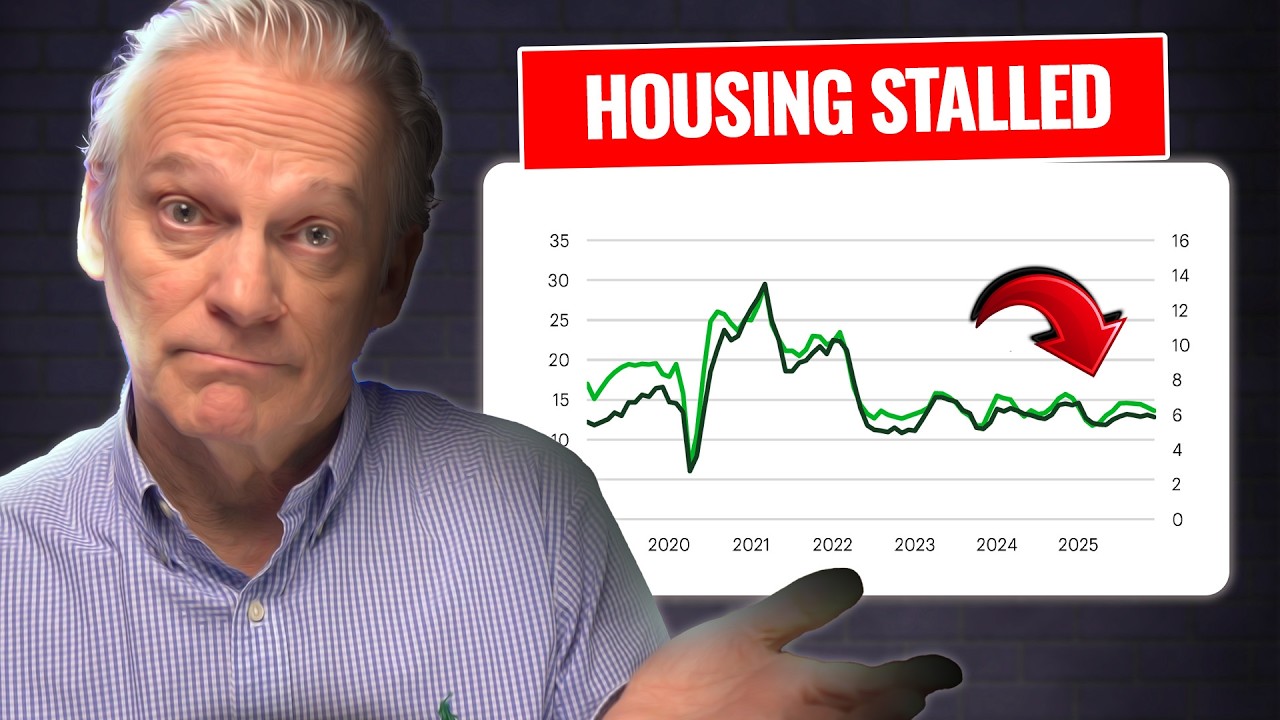
The Canadian housing market is officially broken. In this video, I break down a February 2026 report from CIBC Capital Markets that confirms a "nightmare scenario": home prices are falling, but the market is becoming less functional for both buyers and builders.
While the national benchmark price has dropped by an average of $110,000 since the 2022 peak, "improved affordability" is still out of reach for most Canadians. Meanwhile, the economics of homebuilding are failing, leading to a massive 30% to 50% drop in real housing starts in cities like Toronto and Vancouver.
#CanadaHousing #RealEstateCanada #HousingMarket #CIBC #TorontoRealEstate #VancouverRealEstate #HousingCorrection #BenjaminTal #AffordabilityCrisis
🤗 Join over 500,000+ DIY Investors on the Blossom app (FREE) ➤ https://getblossom.onelink.me/SOfu/brandonbeavis
-----------
📥 Subscribe to the Pulse Newsletter for Weekly Market News ➤ https://thepulse.beaviswealth.com/
Courses & Training - The Investing Academy ➤ https://bit.ly/theinvestingacademy
Follow Us On Blossom ➤ https://getblossom.page.link/brandon
Instagram ➤ https://bit.ly/3Oechgh
LinkedIn ➤https://bit.ly/3RLndF7
Website ➤ https://www.beaviswealth.com
-----------
The above affiliate links are provided for your convenience, and if you click on a link and end up purchasing a product or service, this channel may receive compensation for the referral. We have personally vetted each of these companies and services and, in our opinion, we believe they provide value to our viewers, depending upon your individual circumstances.
Business Inquiries: support@theinvestingacademy.ca
-----------
Beavis Wealth Disclaimer:
The views and opinions shared on this channel are for informational and educational purposes only. Although previously licensed, the contributors are no longer industry participants and are not licensed to provide financial advice. They strive to provide you with educational information in an entertaining manner. Always do your own research and due diligence before investing. Generally speaking, you should consult a licensed investment professional before investing.
Оглавление (3 сегментов)
Segment 1 (00:00 - 05:00)
I want to talk about the Canadian housing market today because it is officially broken. It appears. Read a recent report from CIBC Capital Markets and it just confirmed a nightmare scenario. We have entered a correction in housing prices where the prices are still too high for most people to buy, but they have fallen too low for developers to build and still make a profit. Now, in this video, I'm going to look at three pieces of evidence that show number one, the official numbers don't look that bad on the surface. Uh the real level of housing starts though in cities like Toronto and Vancouver is actually 30 to 50% lower than reported. Number two, even though prices have dropped by an average of $110,000 since 2022 peak, uh this improved affordability isn't nearly enough to solve the national crisis. And number three, we have a disappearing wealth effect and that's hurting consumer spending and the damage is going to hit deeper than it looks. Now, I'm going to say don't shoot the messenger here. I'm just sharing the news. Let's break it down. I want to start with the report chart number one that shows the national benchmark home price relative to its 2016 to 2019 trend line. The report states that after a meteoric asset in home prices during CO, the benchmark price is currently close to where it should have been if CO was just a bad dream. So that's pretty interesting. If we look at this from a national level, things are back to where they should have been in the first place. You might say that's pretty reassuring. But immediately after that, the authors of the study caution this. They say the big picture hides a lot of nuggets. So let's look at those nuggets as they call them. First of all, regionally, the correction is uneven. Ontario's benchmark price, for example, is currently 28% below the trend line, while BC's is 13% lower than it was in early 2022. Meanwhile, much of the rest of the country has remained above the trend, although that gap is starting to narrow. Look at this chart here. This shows unit home sales dropping sharply across the country, literally from coast to coast. BC is the worst, but no part of the country has been spared here. To make matters worse, price cooling is becoming more widespread with Ontario and British Columbia that you'd expect them to be a negative territory. They are joined though by Alberta and Nova Scotia. You can see the national average there that is down as well. In other words, we have moved past this juice being a Toronto and Vancouver story. Now, another thing that we're seeing is that the prices hit very differently at different housing types. The report notes the most significant damage is clearly in the overs supplied condo market where prices nationally are 35% below the trend line after falling by 15% since the peak of early 2022. This chart on your screen makes that gap obvious. So far, single family homes, they're just hanging in there, but condos are being hit hard. And the smaller the condo, at least in the GTE area, the bigger the price declines. Smaller units are seeing a much larger correction in the 25% range. So prices have corrected. We can see that here. But now I really want to have a look at construction because that plays a big role here. Things are more nuanced, but we're going to learn something here. They're still very, very important. The report notes that housing starts averaged a strong 260,000 in 2025, a solid increase of 5% from 2024. So, if you just read that, it sounds pretty resilient, but it isn't. And I'll tell you why here. CHC, they define a housing start as occurring only when the foundation reaches the grade level. So, in a large multif family projects, starts are being recorded one to two years after the start actually occurs. Look at this picture here. If you have a look at the labels on these images, that big hole you see on the left, that looks to me like a housing start, but it's not. The label shows not a construction start. Then you look at the middle photo that looks like construction is well underway. But again, it says this is still not a CHC start according to the way that they record them. Finally, the third picture has a start. And this is when the foundation hits grade. So I guess the deeper the hole, the longer it takes for it to be considered to be a start. You know, I've been in many parking garages. I'm sure you have two, you know, three, four, five stories deep. Apparently, it could take a while they're building that up before it actually officially becomes a start, at least according to CMHC. Now, the implication here should be pretty real. The report itself says, "Today's high-rise starting statistics inform us about activity in late 2024 and not about the here and now. " Using data from urbanization and from Zonda, the authors of this report, they suggest that in the GTA and GVA areas, the real level of housing starts is roughly 50% and 30% below those headline numbers, respectively. So, activity on the ground that is far weaker than the official statistics would suggest. Now, what
Segment 2 (05:00 - 10:00)
about approvals? That's another thing we need to look at here. And again, I suggest caution is warranted. The report states that many developers, mainly in BC and Ontario, apply for approval without a plan to act on it anytime soon. And here's the direct example. In Vancouver, the number of units approved, but with no building permit rose from 19,000 in 2024 to 28,200 units in 2025. The equivalent number in the city of Suriri is 44,300. You can ignore the spelling error that was contained inside the report. Then we see this conclusion. The issue in many cases is not permits and zoning. It's the economics of the project. We really see softness in construction employment. If we look deeper at that, the report notes here that the overall employment in the construction industry has been flat for a while with the most impacted provinces of Ontario and to a lesser extent BC feeling most of the pain. Now, chart 7 in this report that to me shows clearly the regional divergence that we're seeing. Ontario way down, BC down a bit. The rest of the country is still slightly into positive territory. But even here, if you just focus on that top level of data, it understates the future risk. That's what we're talking about here, right? The authors write, "Many developers have chosen to hold on to their core labor supply even if those workers spend all day playing cards. Obviously, that is a strategy that cannot last forever. Now, let's talk about us. Let's talk about the consumer. In the report, there's an interesting section that describes the wealth effect and it says it's a very familiar concept. Your stock portfolio, your house value, when that rises on paper, you feel richer, right? Even though it is just on paper and based on that, you increase your consumption because you feel like you've created new wealth. Now the opposite effect that is the case where falling financial and or real estate values lead to softer consumption and that is what we're seeing right now. The Bank of Canada, this goes back a while, but they once estimated that housing wealth generates about a 5. 7% increase in spending for every dollar increase in home values. Now, this is an older study. This goes all the way back to 2004, but the concept is still valid. In the report, the main objective is to examine the empirical relationship between various components of wealth on consumer spending. It measures MPC. This is the marginal propensities to consume. So using this Canadian data, we found an average MPC out of housing wealth that is at an increase of 5. 7 cents per dollar, much greater than the MPC out of stock market wealth, which is very small, less than a cent. Now, there's also a more recent study in New Zealand and that suggests that the housing wealth effect is much more significant when home prices fall. In other words, the negative is larger than the positive. Now, the report concludes that the decline in housing wealth will have a larger negative impact on the consumer than the positive impact of rising financial wealth. That's just how our brains work. This chart here, it shows that push and pull. This is the percentage change in assets per homeowner from the real estate peak in 2022. Financial assets are way up, but real estate assets are way down. Now, if the Bank of Canada is right on this report goes back a while, but then the impact that we're seeing on falling house prices, that could lower consumption by over $5,000 per household. And if the New Zealand numbers are correct, it'd be a little bit less, but the damage would still be roughly $3,600. The report concludes that we don't know how large the ultimate effect will be, but it is not zero. Now, there's another layer of concern that we've spoken about on this channel before, and that is mortgage renewals. This report estimates that close to 6% of the mortgage portfolio will face more than a 40% increase in mortgage debt payments upon renewal this year. Now, previously, refinancing could provide some relief there. That's no longer the case for many in BC and Ontario where home prices are below the level they were in 2021. Now the authors don't go so far as to call this a systemic crisis, but they do expect a further increase in delinquency rates in the coming quarters. Now there is one clear positive that comes out of this report and that is affordability which has improved at the margin. They say the average price nationally has dropped by $110,000 since the early 2022 peak, implying savings of $22,000 on a 20% down payment for the average house. This chart here shows the average down payments falling across the provinces. Now, there's a ton of data on the screen here. You might want to pause the video, focus in on the area where you live. There are a number of provinces in which the average down payment is dropped over the past year. This chart here, it shows down payments as a share of prices falling to 33%. Now, this is an average down payment. It's not universal across every region
Segment 3 (10:00 - 11:00)
of the country. In some cases, it will help, but the authors of the study here, they don't hold back. They say improved affordability due to lower prices is a welcome development, but it is not large enough to offset the negatives, nor is it a remedy to the country's housing affordability crisis. Now, they end the report with a structural takeaway. They say the current soft patch in housing activity should be viewed as an opportunity to deal with the main reason for higher shelter prices in Canada, the unsustainably high cost of home building. So that is quite a depressing report. We are in a correction, but we're not in an all-out collapse. When we dig beneath the surface, though, we see a number of problems. We see housing starts are weaker than they first appear. We see approvals that aren't translating into actual construction. We're seeing consumer spending. the headwinds that we face there from the declining housing wealth. We see mortgage stress is rising at the margin and lower prices alone. They are not going to solve affordability if building the homes themselves remains so uneconomic. So hopefully this adds some context, clears a few things up for you. Love for you to leave a comment. What is your personal situation these days when it comes to housing? Love to hear what you have to say. As always, I say thank you for watching and we'll see you in the next video.