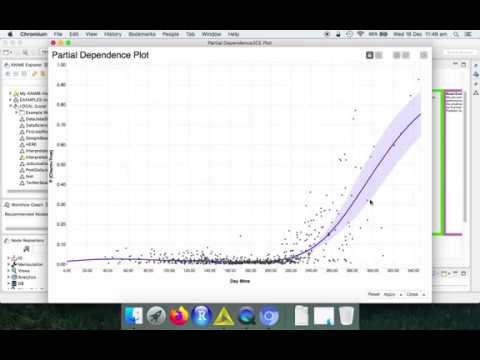
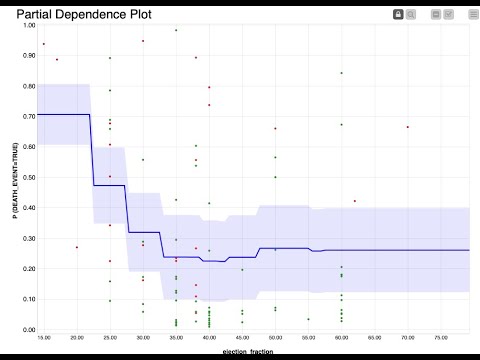
Binary Classification Inspector Node in Knime
Machine-readable: Markdown · JSON API · Site index
Описание видео
An overview of the Binary Classification Inspector Node in Knime. The Knime workflow is available on the KNIME Hub:
https://kni.me/w/Rw9qQzigJwN5qmEH