Excel Pivot Table Tutorial for Beginners
12:36

Excel Pivot Table Tutorial for Beginners

Teacher's Tech 16.02.2020 577 952 просмотров 8 495 лайков обн. 18.02.2026
Поделиться Telegram VK Бот
Транскрипт Скачать .md
Анализ с AI
Описание видео
Want more Excel videos? Here’s my Excel playlist: https://www.youtube.com/playlist?list=PLmkaw6oRnRv8lAKbKbflJRqS-9wuYNWUw In this 2020 video, I will show you to use pivot tables in excel. This excel pivot table tutorial for beginners will show you how to create a pivot table, analyze the data in a pivot table and how to graph in your pivot table data. Learning pivot tables can save you a lot of time and are easy to use. Download sample data used in the video. Make sure to click the download arrow in the top right corner: https://drive.google.com/file/d/1O0QypAIUuQ90OCphY4ifqr9aod9WSzXc/view Other Microsoft Excel Tutorial: Microsoft Excel Tutorial - Level 1: https://youtu.be/k1VUZEVuDJ8 Microsoft Excel Tutorial - Level 2: https://youtu.be/bhZckWTLkJM Microsoft Excel Tutorial - Level 3: https://youtu.be/47yu50CsH00 
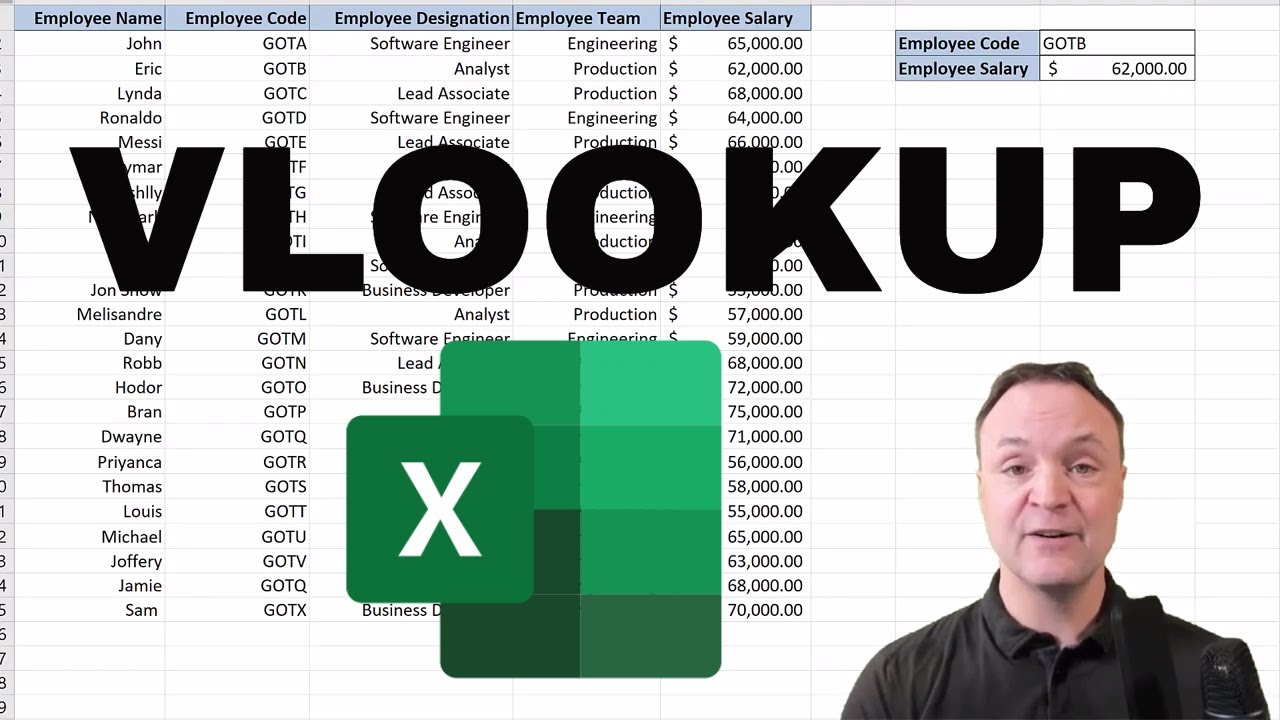
VLOOKUP Function Tutorial: https://youtu.be/Lw03WcG4mt4 How to Make a Line Graph: https://youtu.be/0jdX22qM8JA 10 Best Excel Tips for Beginners: https://youtu.be/ZthlSLYc5UQ

Оглавление (5 сегментов)

  1. 0:00 Introduction 118 сл.
  2. 0:38 Getting Started 672 сл.
  3. 3:45 Pivot Table of Fields 446 сл.
  4. 5:52 More Pivot Table Tips 708 сл.
  5. 9:21 Pivot Table Graphs 634 сл.
0:00

Introduction

hi there Jamie Keith here today a teachers tech hope you having a great day today I'm gonna be showing you pivot tables in Microsoft Excel so I want to show you how powerful these pivot tables are and how much time they can save you even if you're a beginner in Microsoft Excel these will save you a lot of time because you don't have to go through and create these individual formulas that can take a lot of time to do when you use pivot tables they're gonna be able to quickly allow you to analyze your data and get the answers that you want so let's get started with pivot tables with Microsoft Excel today
0:38

Getting Started

so just before we get started just so you know I'll put the link to the file that I'm using here so you can open it up and follow along you'll just have to download it then it will open up in Microsoft Excel then you can play with the same data that I'm doing with this tutorial and also if you're new to Microsoft Excel I'll put a couple links down to some of my beginner tutorials level 1 and level 2 to get you started more familiar with Microsoft Excel but let's get started with these powerful pivot tables today and really just showing you how easy anyone at any level can be manipulating them to get great information so I'm gonna go over two parts with pivot tables I'm gonna show you how to quickly analyze using pivot tables and I'm also going to show you how to chart or graph the pivot tables too so first of all we have our data you can see kind of getting the general idea what it is it's pretty general pretty simple data but for the purposes of today it will work well just to show you how a pivot table works you can see from date we have regions and we have rep names and items and different things that pivot tables gonna allow us to analyze so what I'm gonna do first is I'm actually going to click in the table because I'm gonna show you why I'm gonna do this so I'm just gonna click anywhere I'm gonna click in this cell over here then I'm gonna go to insert and this is where you're gonna find your pivot tables so if I go over to insert here you can see I have pivot tables right here we also have recommended pivot tables so if I go it I'm gonna click on recommend first just to show you what that is but I kind of want to focus on just the pivot table over here if I click on recommend it you can see it starts to give you different items that they might that they think that you might want to pull the information so you can kind of go by some of costs and cost of region and you can kind of click on these and it's going to give you though that information in a hurry based on what they think you might want to see but I'm just going to cancel this for now and I'm going to go into pivot tables over here so the one thing why I wanted to click in it first so if I go and click on it you can see the range is already there so I could have selected my range but if I go a out of it if I'm not clicked in it if I go back to it you can see there's no range in here so it's just kind of like a little tip you can I can go and select my range now and my range I mean the area where all the information is in so you can see it would start up at eight one and it'll go all the way down to my last rows and columns but if I click in this right here and then I go up to pivot table you can see the range is there so just a little tip that could save you know not a lot of time but just it's I just find it easier to do it that way so then you get a few different options and or you can go new worksheet or existing worksheet I want it to go to a new worksheet so it's going to open up a new tab on the bottom and I'm just going to hit OK and you're gonna see it go to a new worksheet and we're ready to go to our next step so you can see what
3:45

Pivot Table of Fields

opened up over here when I created my new sheet I have pivot table of fields now what I can do is I'm gonna be selecting different items from here and they're gonna show up in my cells and I get to choose kind of how I want them to show up in what things I'm comparing them to so for an example I can just click on these and you can see when I click the checkbox well it went down into rows and now I have my row labels you can see these are set up in rows but I don't have to have them in rows I could drag them and drop them into columns and now they're going across this way so I've selected the first one I want to maybe I'll just keep it like this for an example and then I can go through well let's put our ID at my items and so if I click it it's going to go into rows and that's how I'll leave this one because I want to be able to quickly analyzing based on the names and again we could change you know the different formats depending on what you picked I want to be a look at the name and how many items that they sold so if I go to units right here and I'm gonna click this one this is goes into my values over here so I can see in a hurry now I can look at a name and what the item is and see how many of each item that they saw so again if you don't want any of these in I can drag them out just like this or you can also drop down in there's remove from fields so on the sheet that you have that you've downloaded try putting these in and checking to see just as you play around and you'll see sometimes when you drag them into different spots things aren't gonna look at quite right so if all sudden if I add a region well this looks fine as over here because now I can break it down even further into region but if you are grabbing them and putting them into the columns maybe it gets a little less maybe it doesn't you can't read it as well as different one so you can play it in different ways but take a moment right now and with the data that you have try to manipulate and try to get different answers or we try to look for something using the technique I just showed you okay so now
5:52

More Pivot Table Tips

I want to show you a few more tips what I'm gonna do is actually grab this region area out and just drag it out so back to where I had it before and just show you some more things that you can do with your information that you've asked it to provide for you now I can go over to these drop downs here and maybe I don't want all the names selected if I drop down you can see the different names of the people if I take off a few here maybe I just wanted to quickly be able to look at less people and I hit okay well there you go I'm only comparing the people that I want so we can quickly do these things so check on the dropdowns you and then you can go through and add them back if you want but makes a quick way to really analyze your data the other thing is maybe you want to sort things so what I can do if I go over here and right click I get these different options and here you can see that there's sort and maybe I want to go smallest to largest and ivory sorted the information on that pivot table to kind of represent it in maybe the way that I want to so before we move on to some charting I just want to give you a couple extra tips here to just make your pivot tables more just more powerful so you can find more information in them so the first thing is I'm just going to make a quick change here I'm gonna take away units instead and I'm gonna put in total and now these are my total amounts you can format these just like you do with your normal spreadsheet so if I wanted this to be in dollar amounts so I can just click my dollar and you can see how the format is different now the next thing I just wanted to show you was down here under values so I'm just under sum of total you can change this to by if I go to value field settings I can take a look at I can change it from here I am under some but you can go through and take a look at different ones so if I was going under a average now this won't make much sense for this one but you can see how it does adjust if I was going to something like account so I'll go back to value field settings and I'll go to count and hit OK well now it does make sense that the dollars are there because it's just counting up the different sales of it but if I go back I can just go to general and it will turn it back like so you can adjust the formatting to it now I want to show you something else here too so I'm going to quickly just make an adjustment I want I'm gonna move my reps down into a column and I just want to go with totals so now I have quickly I can see their names to the total right across from them I could format it just like I showed you before but what I want to show you now is if I right-click on this one and then I go show value as you can go through and just for it to quickly do percentages of or you can see all the different things if I wanted to go percent of column total it quickly gives me so also and I know Kathy is twenty three point four point three one percent of the total and you can get some quick percentages that way so these are just a couple more tips to look that look at and remember to be looking right click to find information and then even under the different ones take a look at what you can change through field settings on it and using the data just try to play around and try to manipulate it as much you get as you can pivot tables allow
9:21

Pivot Table Graphs

you to quickly graph your information so I'm just going to be I have reps in my total and I'll make some quick graphs of this and show you how quickly you can add more things to it and change of how you want it to look so I'm gonna go I have my pivot table here I'm gonna go up to insert and I'm gonna go over to pivot chart and click on this and when I click on it I get the options you can see a default adjust to the column one and if I go through it I can pick different ideas from the 3d one it gives me a little preview of what it looks like you can go through and kind of see what would be the best for you to represent your data where people can quickly look at it and pull that information out at a glance from it I'm just going to go with a bar graph on this one and I'm going to just hit OK and from here you can still add your more pivot field so if I wanted to look at units also you can see it quickly added them I have my values on the side so you can go through test out what gives that the information you want to give to your audience or whoever's while looking at it so I'm gonna just turn it off this one I'm gonna leave this pretty simple the other thing I want to show you is how to manipulate the way you want your graph to look well you could click in any of these and you could write to whatever you want on it but if I go ahead and I'm gonna just right click on this one and you get all these different in for me all this all the things you can do but what I want to open up is format the chart area and I get this to come up here now I'm under that you can see as I click on different ones I can go through for instance will look at these right here if I click on those and now this opened up here well maybe I want them to be thicker and so I just put the gap with tool ass and now the lines or thicker I think that makes it a little easier to read like that on it yeah I can go through all the different things you can see from here at the different options if I click on something I'm going to have different options to looks to its own ate now I added a little bit of a shadow around it this you can go through and look at the borders of it if I drop down I can go through if I wanted the plot area different I can click on the plot area and now I can go through and change things and adjust things you can really just quickly get things looking the way you want to make these graphs look quite professional and all the information that you want to show so I hope you found this pivot table tutorial useful and that maybe a look at really taking advantage of this powerful part of Excel here let me know in the comments if there's other things about pivot tables you want to learn I just kind of touched the surface of this and let me know if there's other Excel tutorials that you're interested in learning that I could create for you to kind of help you understand it more but anyways thanks for watching this week on teachers tech I'll see you next week with some more tips and tutorials

Ещё от Teacher's Tech

Ctrl+V

Экстракт Знаний в Telegram

Транскрипты, идеи, методички — всё самое полезное из лучших YouTube-каналов.

Подписаться