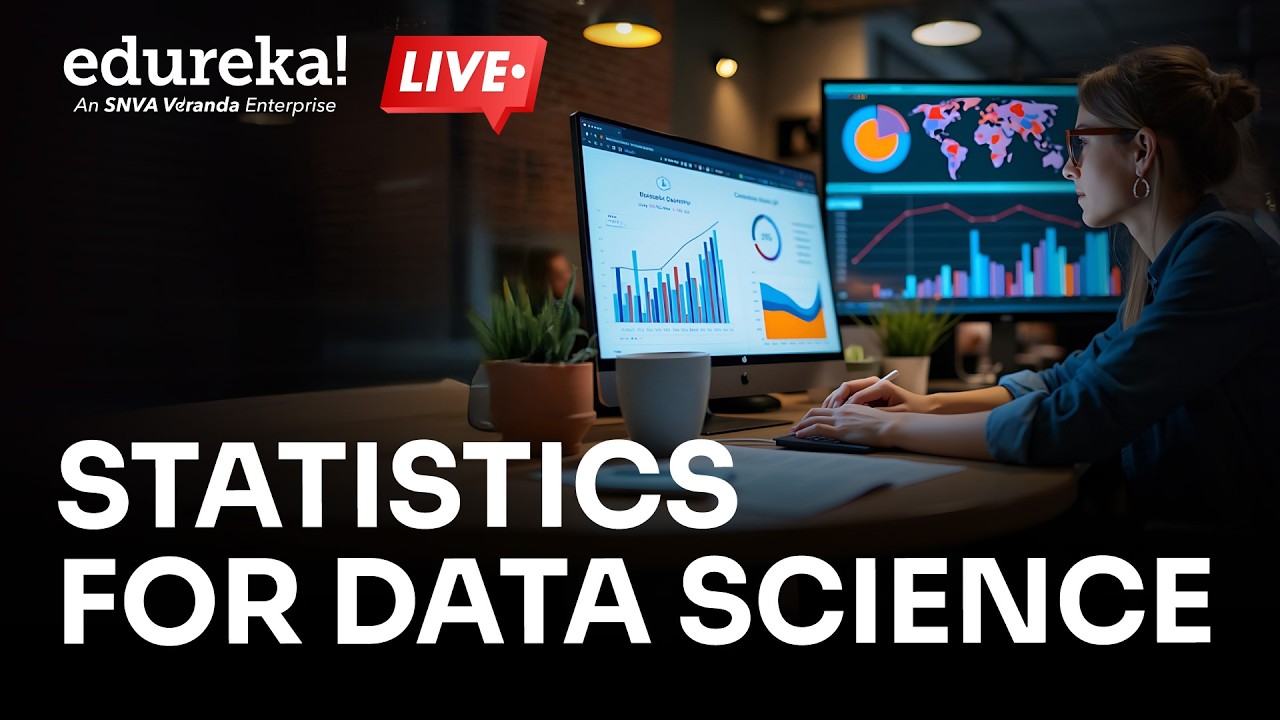
Data Science Made Easy with Statistics & Probability | Data Science Roadmap 2026 | Edureka Live
Machine-readable: Markdown · JSON API · Site index
Описание видео
🔥𝐄𝐝𝐮𝐫𝐞𝐤𝐚 𝐃𝐚𝐭𝐚 𝐒𝐜𝐢𝐞𝐧𝐜𝐞 𝐰𝐢𝐭𝐡 𝐏𝐲𝐭𝐡𝐨𝐧 𝐂𝐞𝐫𝐭𝐢𝐟𝐢𝐜𝐚𝐭𝐢𝐨𝐧 𝐂𝐨𝐮𝐫𝐬𝐞 : https://www.edureka.co/data-science-python-certification-course (𝐔𝐬𝐞 𝐂𝐨𝐝𝐞: 𝐘𝐎𝐔𝐓𝐔𝐁𝐄𝟐𝟎)
🔥𝐄𝐝𝐮𝐫𝐞𝐤𝐚 Integrated MS+PGP Program in Data Science & AI : https://www.edureka.co/dual-certification-programs/ms-data-science-pgp-gen-ai-ml-birchwood
This session on Statistics And Probability will cover all the fundamentals of stats and probability.
✅ Subscribe to our channel to get video updates. Hit the subscribe button above: https://goo.gl/6ohpTV
📝Feel free to share your comments below.📝
𝐄𝐝𝐮𝐫𝐞𝐤𝐚 𝐎𝐧𝐥𝐢𝐧𝐞 𝐓𝐫𝐚𝐢𝐧𝐢𝐧𝐠 𝐚𝐧𝐝 𝐂𝐞𝐫𝐭𝐢𝐟𝐢𝐜𝐚𝐭𝐢𝐨𝐧𝐬
🔵 DevOps Online Training: http://bit.ly/3VkBRUT
🌕 AWS Online Training: http://bit.ly/3ADYwDY
🔵 React Online Training: http://bit.ly/3Vc4yDw
🌕 Tableau Online Training: http://bit.ly/3guTe6J
🔵 Power BI Online Training: http://bit.ly/3VntjMY
🌕 Selenium Online Training: http://bit.ly/3EVDtis
🔵 PMP Online Training: http://bit.ly/3XugO44
🌕 Salesforce Online Training: http://bit.ly/3OsAXDH
🔵 Cybersecurity Online Training: http://bit.ly/3tXgw8t
🌕 Java Online Training: http://bit.ly/3tRxghg
🔵 Big Data Online Training: http://bit.ly/3EvUqP5
🌕 RPA Online Training: http://bit.ly/3GFHKYB
🔵 Python Online Training: http://bit.ly/3Oubt8M
🌕 Azure Online Training: http://bit.ly/3i4P85F
🔴 𝐄𝐝𝐮𝐫𝐞𝐤𝐚 𝐑𝐨𝐥𝐞-𝐁𝐚𝐬𝐞𝐝 𝐂𝐨𝐮𝐫𝐬𝐞𝐬
🔵 DevOps Engineer Masters Program: http://bit.ly/3Oud9PC
🌕 Cloud Architect Masters Program: http://bit.ly/3OvueZy
🔵 Data Scientist Masters Program: http://bit.ly/3tUAOiT
🌕 Big Data Architect Masters Program: http://bit.ly/3tTWT0V
🔵 Machine Learning Engineer Masters Program: http://bit.ly/3AEq4c4
🌕 Business Intelligence Masters Program: http://bit.ly/3UZPqJz
🔵 Python Developer Masters Program: http://bit.ly/3EV6kDv
🔴 𝐄𝐝𝐮𝐫𝐞𝐤𝐚 𝐔𝐧𝐢𝐯𝐞𝐫𝐬𝐢𝐭𝐲 𝐏𝐫𝐨𝐠𝐫𝐚𝐦𝐬
🔵 Post Graduate Program in DevOps with Purdue University: https://bit.ly/3Ov52lT
🌕 Advanced Certificate Program in Data Science with E&ICT Academy, IIT Guwahati: http://bit.ly/3V7ffrh
🔵 Advanced Certificate Program in Cloud Computing with E&ICT Academy, IIT Guwahati: https://bit.ly/43vmME8
📌𝐓𝐞𝐥𝐞𝐠𝐫𝐚𝐦: https://t.me/edurekaupdates
📌𝐓𝐰𝐢𝐭𝐭𝐞𝐫: https://twitter.com/edurekain
📌𝐋𝐢𝐧𝐤𝐞𝐝𝐈𝐧: https://www.linkedin.com/company/edureka
📌𝐈𝐧𝐬𝐭𝐚𝐠𝐫𝐚𝐦: https://www.instagram.com/edureka_learning/
📌𝐅𝐚𝐜𝐞𝐛𝐨𝐨𝐤: https://www.facebook.com/edurekaIN/
📌𝐒𝐥𝐢𝐝𝐞𝐒𝐡𝐚𝐫𝐞: https://www.slideshare.net/EdurekaIN
📌𝐂𝐚𝐬𝐭𝐛𝐨𝐱: https://castbox.fm/networks/505?country=IN
📌𝐌𝐞𝐞𝐭𝐮𝐩: https://www.meetup.com/edureka/
📌𝐂𝐨𝐦𝐦𝐮𝐧𝐢𝐭𝐲: https://www.edureka.co/community/
- - - - - - - - - - - - - -
What is AI(Artificial intelligence) ?
AI (Artificial Intelligence) is like brainy computer programs that learn from data. Imagine a super-powered tool that analyzes information and helps you create or solve problems. It can suggest new ideas, write stories, or design art! AI is here to be your creative partner, not a replacement.
- - - - - - - - - - - - - -
Types of Artificial Intelligence.
Imagine intelligence on a spectrum, with humans at the complex end. Here's the breakdown of weak AI and strong AI on that spectrum:
Weak AI (Narrow AI): This is the kind of AI we see most today. It's like a super-powered tool for a specific task. Think of a chess-playing program or a spam filter in your email. Weak AI excels at one thing, but can't necessarily apply that knowledge to other areas. It's like a super-skilled athlete who dominates their sport but might struggle in others.
Strong AI (General AI): This is the realm of science fiction (for now). Strong AI would be much more human-like. It could learn and perform any intellectual task we can, like writing a novel or solving complex math problems. Imagine an athlete who can excel in any sport they try!
Here's the key difference: Weak AI is a specialist, strong AI is a generalist, like a super-powered human brain.
- - - - - - - - - - - - - -
What does AI do at its core?
AI's core superpower is discovering secrets from information. It analyzes massive amounts of data, like text or images, to find patterns and connections. With this knowledge, it can then perform tasks like making predictions, creating new things, or even making decisions.
For more information, please write back to us at sales@edureka.in or call us at IND: 9606058406 / US & Others: +18885487823 (toll-free)
![AI for Business Full course in 11 Hours [ 2026] | How AI Could Empower Businesses | Edureka Live](/thumbnail/cG1W_AgYRRo.jpg)
![Natural Language Processing (NLP) Full Course – Beginner to Advanced [2026] | Learn NLP with Python](/thumbnail/H9yC8Hq0tHk.jpg)