
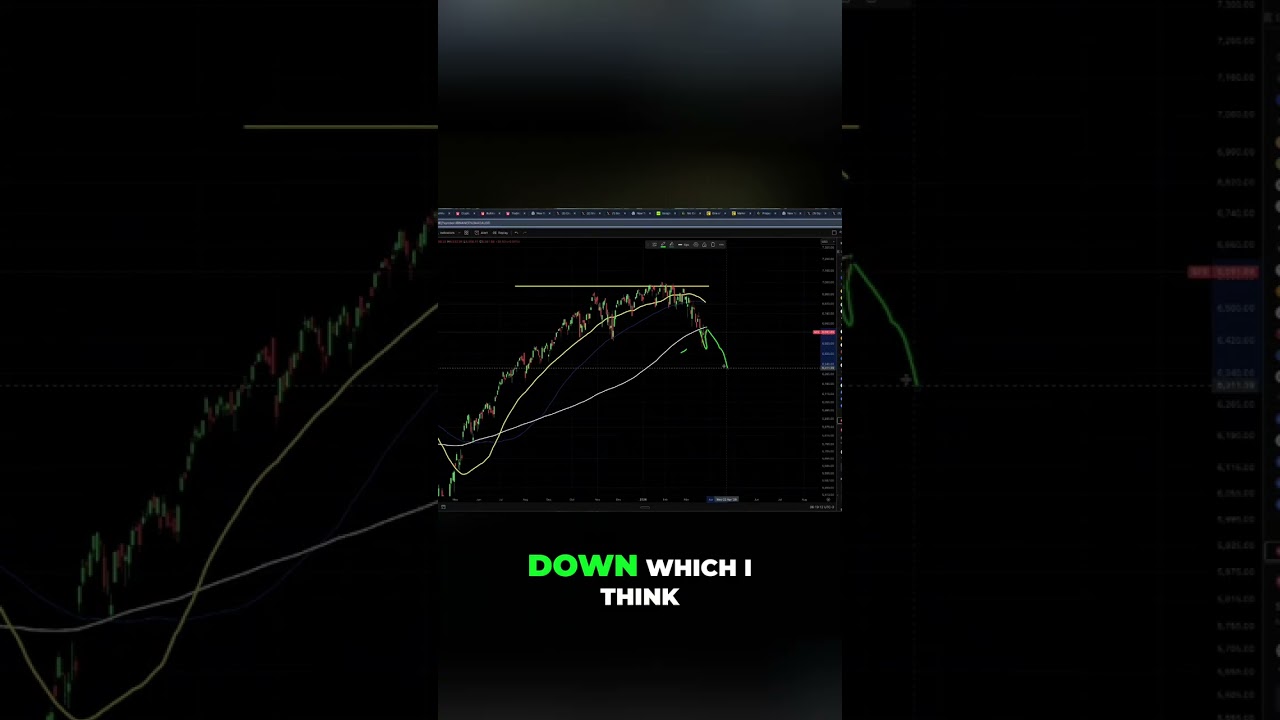
If 2026 Is the New 2022, Bitcoin Is About to Do This...
Machine-readable: Markdown · JSON API · Site index
Описание видео
🔥 FREE TRAINING: https://www.bullmania.com
💰 EXCHANGES I USE (bybit, pionex): https://www.bullmania.com/partners
Machine-readable: Markdown · JSON API · Site index


Экстракты и дистилляты из лучших YouTube-каналов — сразу после публикации.
ПодписатьсяЛучшие методички за неделю — каждый понедельник