SQL Window Functions are one of the most valuable skills every Data Analyst should know. In this tutorial, we'll use a realistic business dataset to learn the window functions that analysts actually use on the job.
You'll learn how to build:
Running Totals
Rankings with ROW_NUMBER()
Moving Averages
Previous Row Comparisons with LAG()
Business-Level Analysis using PARTITION BY
We'll start with simple daily sales data and then level up by adding business groups, showing exactly how window functions are used in real-world reporting and dashboards.
Whether you're preparing for a Data Analyst interview or looking to improve your SQL skills, these are the window functions you'll use over and over again.
Data set:
https://github.com/Gaelim/youtube/blob/master/sales_orders.csv
My linkedin
https://www.linkedin.com/in/gaelimholland/
#SQL #DataAnalytics #DataAnalyst #LearnSQL #WindowFunctions #SQLTutorial
Оглавление (4 сегментов)
Segment 1 (00:00 - 05:00)
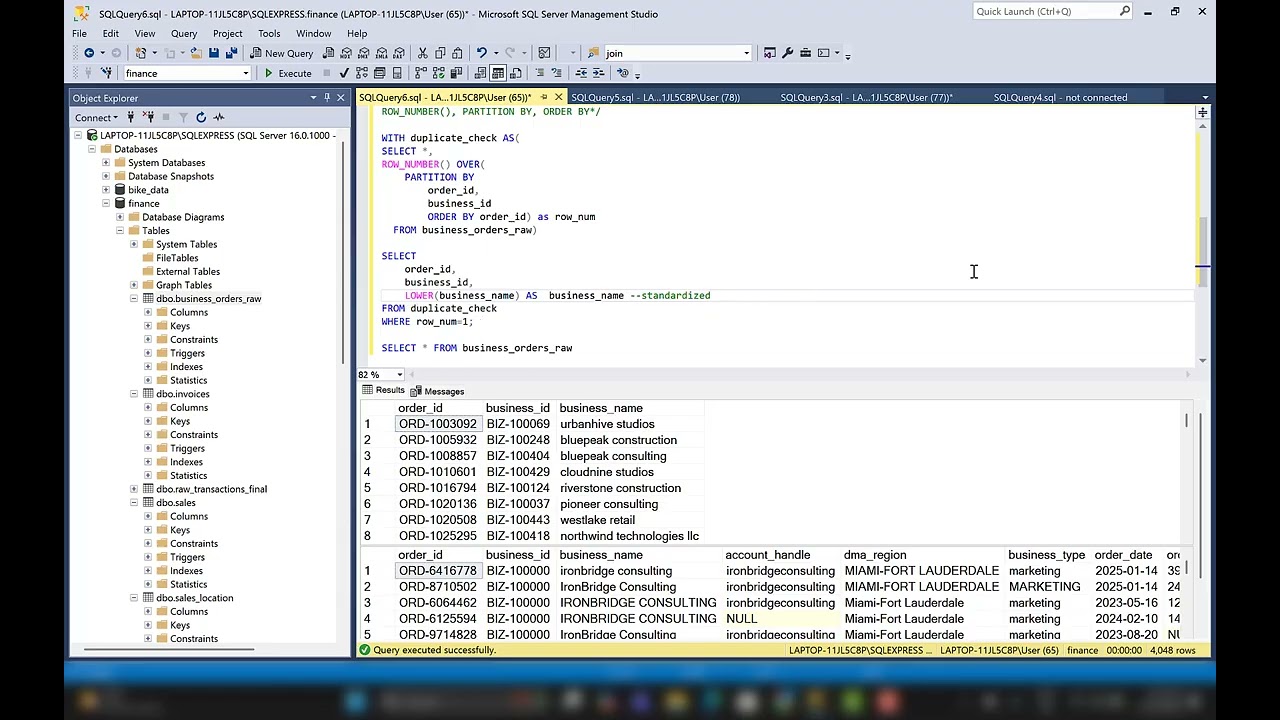
Hi, I'm going to show you all the window functions you need as a data analyst and how to use these window functions to bring back different sets of data. So, we have a data set here where we have the order ID, the order date, the business ID, the business name, salesperson, region, product category, quantity, unit price, and sale amount. So, we usually get a request from a manager that ask us to roll up some data. So, as you see here, it says roll up the orders up to one row per day or business, and then give us uh the how the rank for each day, the total for each uh period, sales building up over time, which sounds like a running sum, a trend, which would be moving average, and then compare um the previous and active day, which we're going to use lag for that. So, if we look at our data set, we don't have data at a daily level in a sense. We have a daily level at the business or order ID level. So, the first thing we want to do is get our data grouped by the day. So, the first thing we want to do is just use a simple group by. So, we'll take this query that we have here and just bring back order date and we will bring back the sum of the sales because we need to group or sum this by day. And as you can see there, are multiple days uh per order ID, so we're going to sum the sale amount here. So, sales amount. And let's call that as daily under core sales. And because we're using an aggregation, we need to group by the order date cuz we're summing that amount and grouping by the order date. And this should give us what we need, so let's run that. Now we have our daily sales. Now, we want to be able to select from this in order to build or an answer the questions we want. So, let's turn that into a CTE or common table expression, and let's call this a daily sales table as and then encapsulate that into um with parentheses, and now we can just select whatever we want from our daily sales uh common table expression. And now you can see we bring back the same thing. Now, because we have those uh columns already in that uh table expression, we get the order date, and now we can get that daily sales [snorts] from that table. And the first thing we want to do is rank our sales. So, we're going to use row number, which is our first window function. So, let's use row underscore number. And because this is a function, you're going to have these parentheses. Now, window functions indicate that there's a window. So, a period or a segment [snorts] that you're looking at. And the way we define that is with over. And what is going to do is tell our function how to evaluate the data. So, we want to get the rank of our sales. So, we want to find the highest and lowest sales. So, we are going to order by the daily underscore sales. And that is going to give us the sales. And let's get this is descending where one will be the highest. And that's our row number. Now, let's name that as our sales rank. And make sure we have a comma here. And let's run that. And where daily sales, we have an issue. Daily sales, uh misspelling there. Daily sales. Okay. So, now you can see the highest value
Segment 2 (05:00 - 10:00)
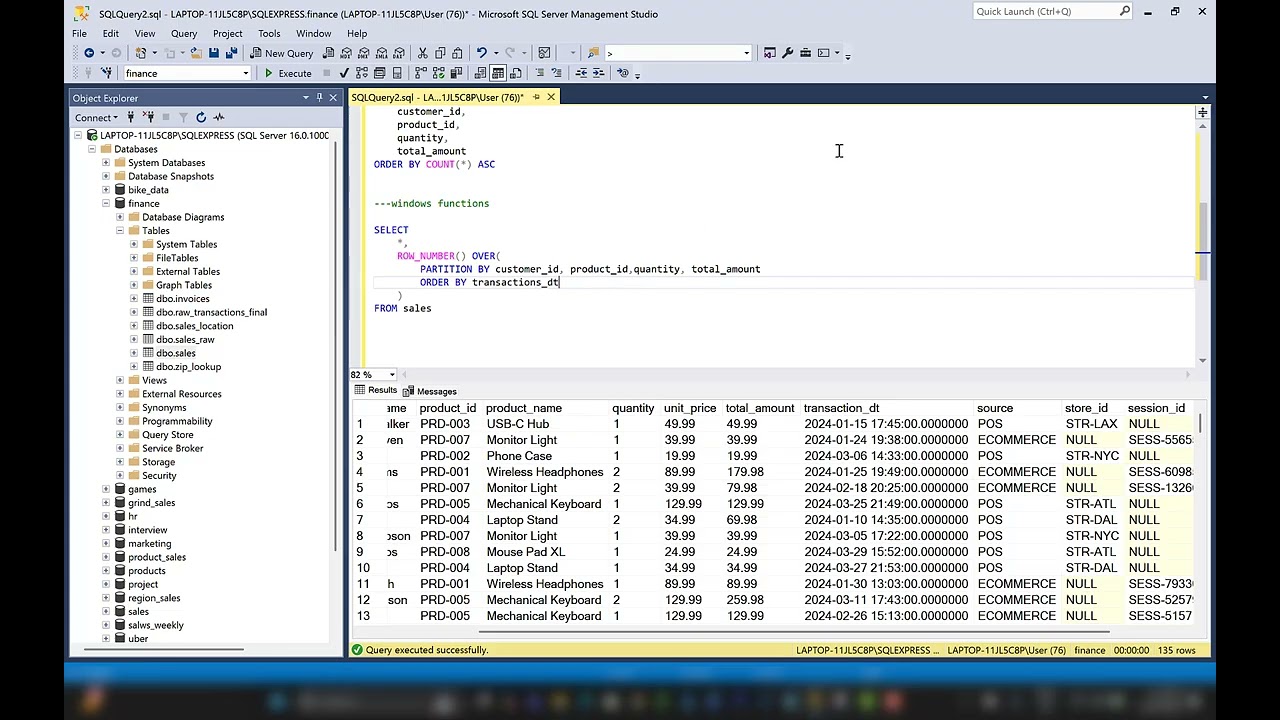
gets the highest rank. And this is going over the total data set. So, we can see uh out of all the days, which was the highest, which was 12 Now, let's move on to the next window function. We also want to answer the other questions, which is the running sum, all right? So, because uh that is our sales over time. So, what we can do is we can sum. What do we want to sum? We want to sum that sales amount and then encapsulate that. Then we use our window over. How do we want to o- organize this? We want to order by the order date, right? Because that's over time. So, we are going to get a running sum. And then we just call it as running sum. I just have a comma there, sales amount over order by. Let's run that. And we have sales amount sales Oh, this is my mistake. We do not have a sales amount. Remember, we made the CTE, and we summed the sales amount. So, we are using daily sales. Now, this should work. Run that, and now you can see we have a running sum over each day until we get to the end of the data set that gives us the total running sum. Now, let's go to the next one. Well, let's get a moving average around uh period. So, we know we're using average. We're using daily sales. Now, we have this window, which is over. Now, this gets a little bit more complicated. We're still going to use order by the order date. But, we need more. If we're using a moving average, we need to tell the function how many days to put in our moving average. So, I'm just going to copy this down, and then I'm going to use rows between two cuz I'm going to get a three-day average. So, rows between two, so we're going to count down two preceding and current row. Now, it's a lot to remember. Two preceding and current row is going to give us a 3-day moving average, so I'm going to say moving average. And 3-day. All right. Um I'm just going to put moving average cuz we can always change that window. Uh put a comma, comma as moving average. Uh and yes, let's see if that runs. No. Order by order date needs to be closed. Order date. Oh, there we go. So, now we have a 3-day moving average. So, here's our uh daily sales here. Um so, we are going to average over time as you see here. And we're going to keep going down and moving that window to get our uh moving average of 3 days. Now, the last one we're going to put together is we want Let's go back up. We want to see recent uh not that one. We did recent trend. How day compares to the last active day. So, we are going to look at the previous day. And the way we use that is a function called lag. Now, there's two functions, lag and lead. Lag looks at the previous row. Lead looks at the next row. So, let's lag. And then we need to also tell it what to lag. So, we're going to lag our daily sales. That's the value we want. Um and then we're going to lag by one. So, we will use over again. And then we will order by order date. _date and Let's put a comma here and let me just show you what that looks like. I won't
Segment 3 (10:00 - 15:00)
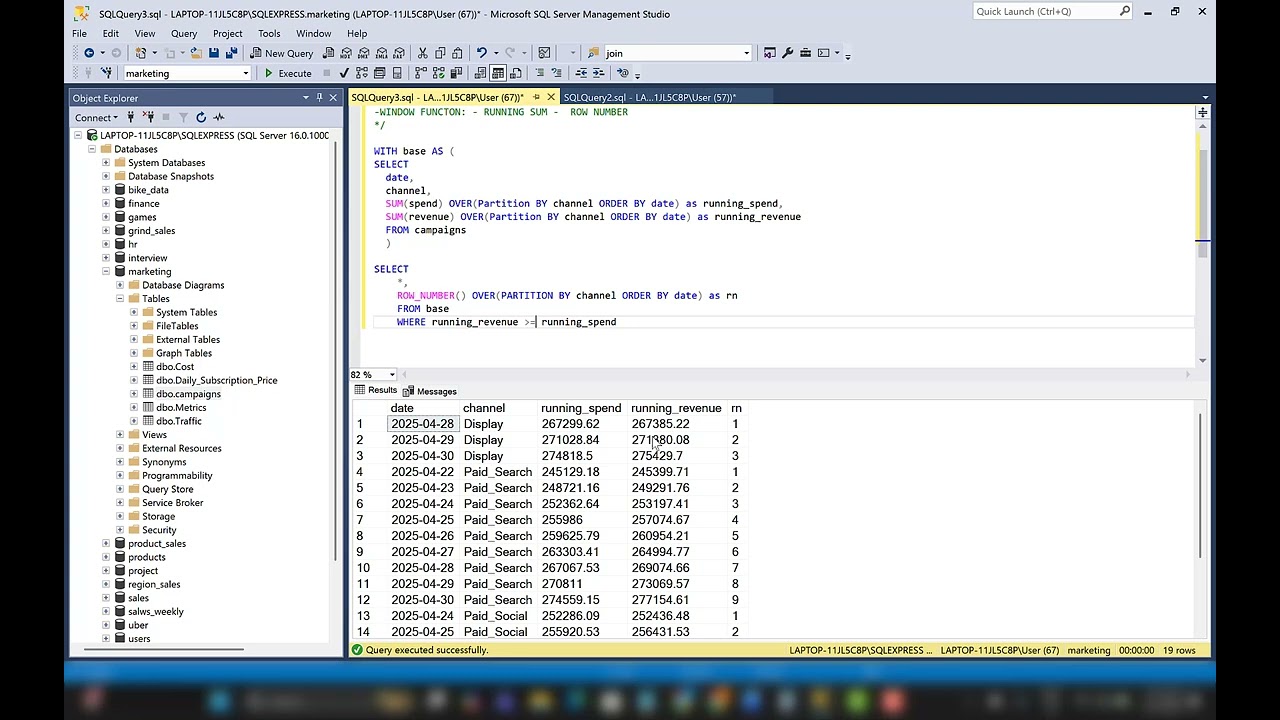
name that anything at the moment. Let's run that. Okay. What it's taking is that previous value and pushing it down. So, you can imagine how we could see a difference there as let's say change from previous. And then I can take the current row, which is daily sales. And minus that. And let's clean this up. Bum bum. Let's see if it runs. Okay. So, now we can see 678 on 1/4 and 838 on 1/6, we get the difference of 160. So, that is very good window functions. Now, what happens when we want to add more? If we have another category, right now we have order date, but this asks for things by business. Now, we do have the business name. So, what I'm going to do is copy this and then I'm going to put a semicolon behind it so we can run both at the same time. And then I copy this and I'm going to just say business partition. And you'll see why. So, let's add the business name to our CTE business name. And we also want to bring business name down here. Now, I'm going to just comment these out quickly and let's start with row number. Um Okay. So, if I want to get the rank within the business name, cuz right now we have rank over the whole data set. But, if I want to see which sales are number one per the business, all we have to use is partition by and then we put business _name. And now, if I Let's see if I can run that. Let me get rid of the comma. Run that and what's going on? Let's see. Blah blah blah blah blah. Row number order by partition. Uh comma near from another comma. So, we just need Let's see. Uh-oh, no. Yep. Uh we are just missing a comma. Now, we should be able to run this. Uh order date business name Uh one more thing, we need to group by the business name. Okay. So we have grouped by the business name. Okay, there we go. So what we have is we group by business name in our CTE. Then we have our row number where we are ranking the number one sales across the data set in our first query. And now as you see here, we are ranking according to the business. So we're finding the biggest sale amount in that business. So that's what our rank is going to do now. As you see here, we just have to update our code with partition, which is telling each one of these window functions how to update or how to split our data. So I'm going to copy partition by business name here. And then I'm going to update each one of these. So order by right before order by and
Segment 4 (15:00 - 16:00)
And now I'm not going to run this previous queries. I'm just going to highlight this one. And see if we run this. Okay, so and no comma. What about Okay, now we can run that. And now you can see we have updated everything. For example, running total, you can see that uh reset by each business. So, this is a this is how you can easily turn your window functions into very sophisticated and impactful data sets. And what we have now, we answer all the questions that they want here by rolling up our data by date and business and performing uh performing a moving average, a running sum, a rank, and a change over previous. Let me know how you would have handled this or what windows functions you want to actually see in the next video or anything you would have done differently. Please like and subscribe and share this video with anybody you think it will help. Thank you.