Join this channel membership to get access to all the recorded bites as they become available:
https://www.youtube.com/channel/UCJ7UhloHSA4wAqPzyi6TOkw/join
Here you can download all the pbix files: https://curbal.com/donwload-center
SUBSCRIBE to learn more about Power and Excel BI!
https://www.youtube.com/channel/UCJ7UhloHSA4wAqPzyi6TOkw?sub_confirmation=1
Our PLAYLISTS:
- Join our DAX Fridays! Series: https://goo.gl/FtUWUX
- Power BI dashboards for beginners: https://goo.gl/9YzyDP
- Power BI Tips & Tricks: https://goo.gl/H6kUbP
- Power Bi and Google Analytics: https://goo.gl/ZNsY8l
☼☼☼☼☼☼☼☼☼☼
POWER BI COURSES:
Want to learn Power BI? How about you take one of our courses? Here you can find the available courses:
https://curbal.com/courses-overview
☼☼☼☼☼☼☼☼☼☼
ABOUT CURBAL:
Website: http://www.curbal.com
Contact us: http://www.curbal.com/contact
QUESTIONS? COMMENTS? SUGGESTIONS? You’ll find me here:
Linkedin ► https://goo.gl/3VW6Ky
Mastodon ► @ruthpozuelo@techhub.social
Twitter ► @curbalen
Facebook ► https://goo.gl/bME2sB
#CURBAL #SUBSCRIBE
Оглавление (2 сегментов)
Segment 1 (00:00 - 05:00)
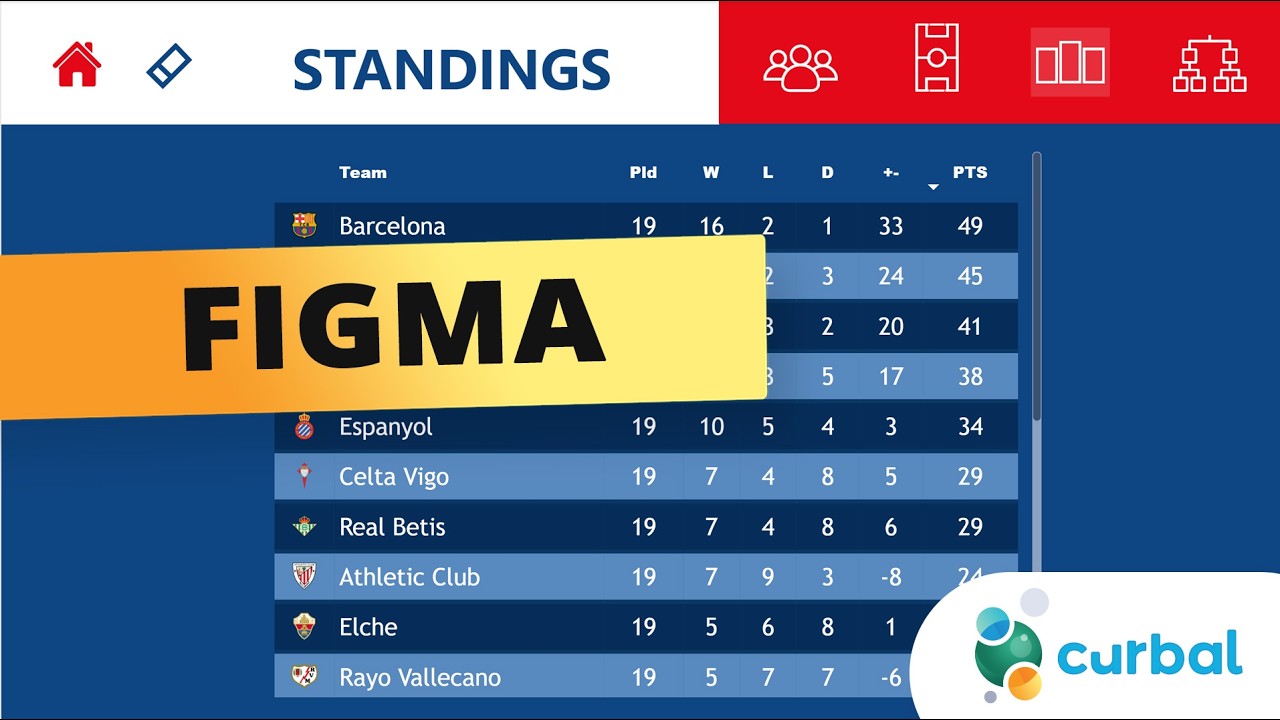
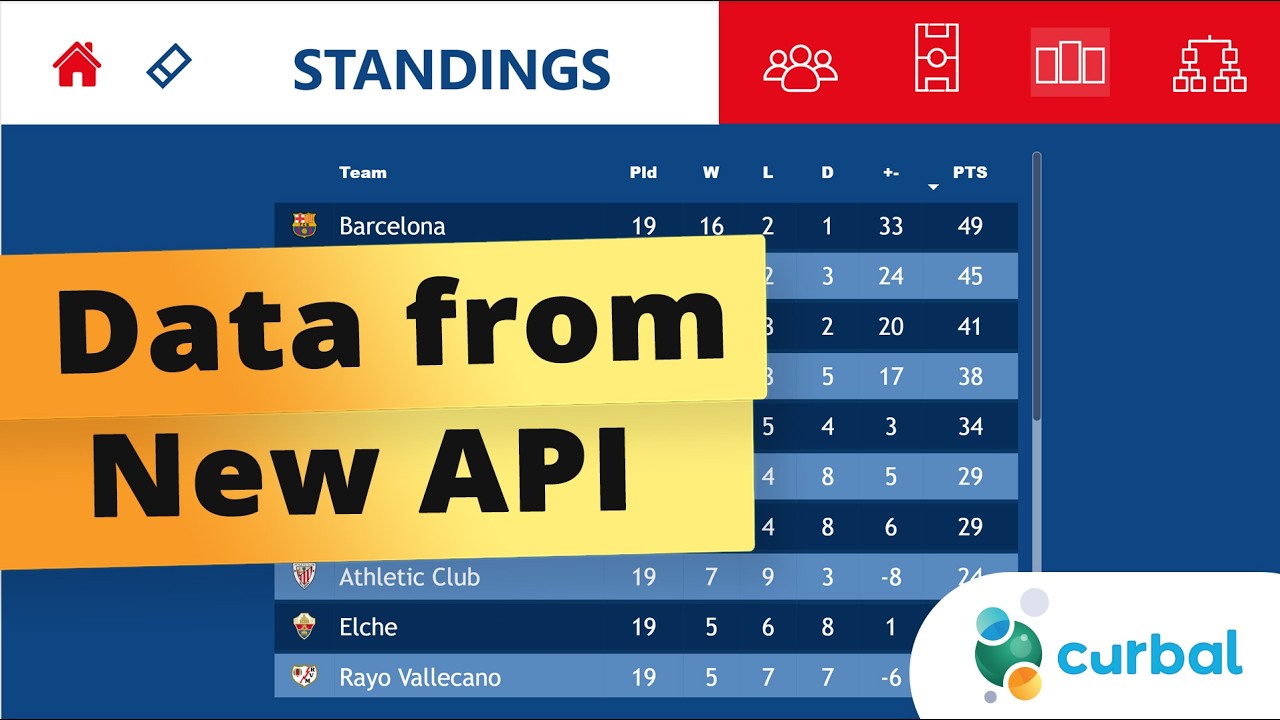
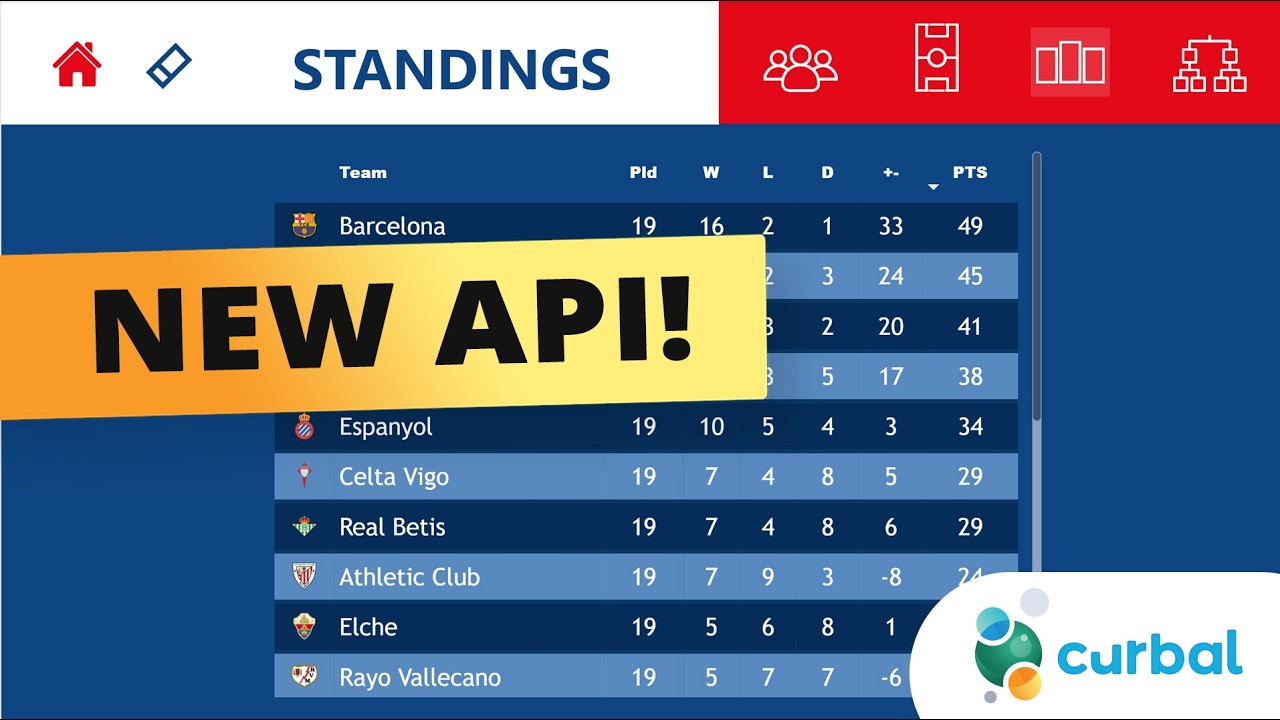
So, it's time to design our report. I hope that the new API is working for all of you. We're going to use Figma. You can use anything that you like. The reason I would use Figma is because it has some functionality that allows you to do things quickly, but also you can export things as SVGs. You want to have your backgrounds as SVGs because they resize, right? If you use PNG or JPEG, you use bigger screens, you put this in a bigger, you know, you design it like this and then you put it is just not going to look very good. SVGs. So, our report is very simple, yet powerful. — We have the summary, we have the standings, and we have the matches. The standings and the matches share the same background. The summary is a little bit different. But it's actually quite basic, which is perfect to get started with Figma. Um when it comes to design, when I am designing something, I always look for uh things on the topic online to see if I can get some kind of inspiration. So, I'm going to show you. When I was planning So, when I was looking into doing the La Liga report this have done 2 years ago, maybe a year ago, I don't remember. So, I went online and I found this. I thought it looked quite nice. And then there are a few more. I have this one. This is not for La Liga, but you know, so you get an idea of how these things are normally visualized. This is also for La Liga. So, this is where the inspiration comes from. It's not exactly the same, but it's quite similar because I thought the look was quite cool. So, let's go back to Figma now. We're going to add a new page, which is going to be La Liga. And here we're going to create a rectangle that is going to be the size of the Power BI file. So, if it is 16:9, you can find it here on the format pane. It's 720 1280. If you remember, there was like the grass from a football field on the background. So, I grabbed these from here, uh unsplash. com. And this is the image. So, you can go there and download it. It's for free. You just have to give attributes to the owner of you know, to whoever took the picture. Go back here. Hello. You paste it in there. So, we want these the same size. Doesn't really need to be exactly the same size because we are only showing a part of the background. Like that. So, it doesn't really need to be the same size. So, the next thing that is we have like this blue stuff. It's like a rectangle that goes like that. And they are this blue. Is this blue. You can pick any blue that you like. And then there is a red part in here. You can make it like this big. Something like that. Pick the color. It's red. There you go. So, click on there. Change to red. And then we have a bunch of icons. I like to have the icons in Figma. Here's the thing, everything that you put in your Power BI report has to load. So, if you put everything in your background, the background loads once. If you put all the icons and stuff in, you know, as separate elements, everything has to load. It makes your report slower. So, everything you can put in here that is not dynamic, put it in here. Um so, we're going to grab the house, which means go home. Is this beauty here. We have the house in there. I'm going to put it kind of there. Zoom in. So, you can see a little bit better. The name of the league, I'm not going to write it in here because I'm going to show you how to make this dynamic afterwards. And then I have two more icons, one for matches and one for standings. I actually have more icons for other reports. So, as this report, we just need these ones. So, we have the standings. You can put the name there if you want.
Segment 2 (05:00 - 09:00)
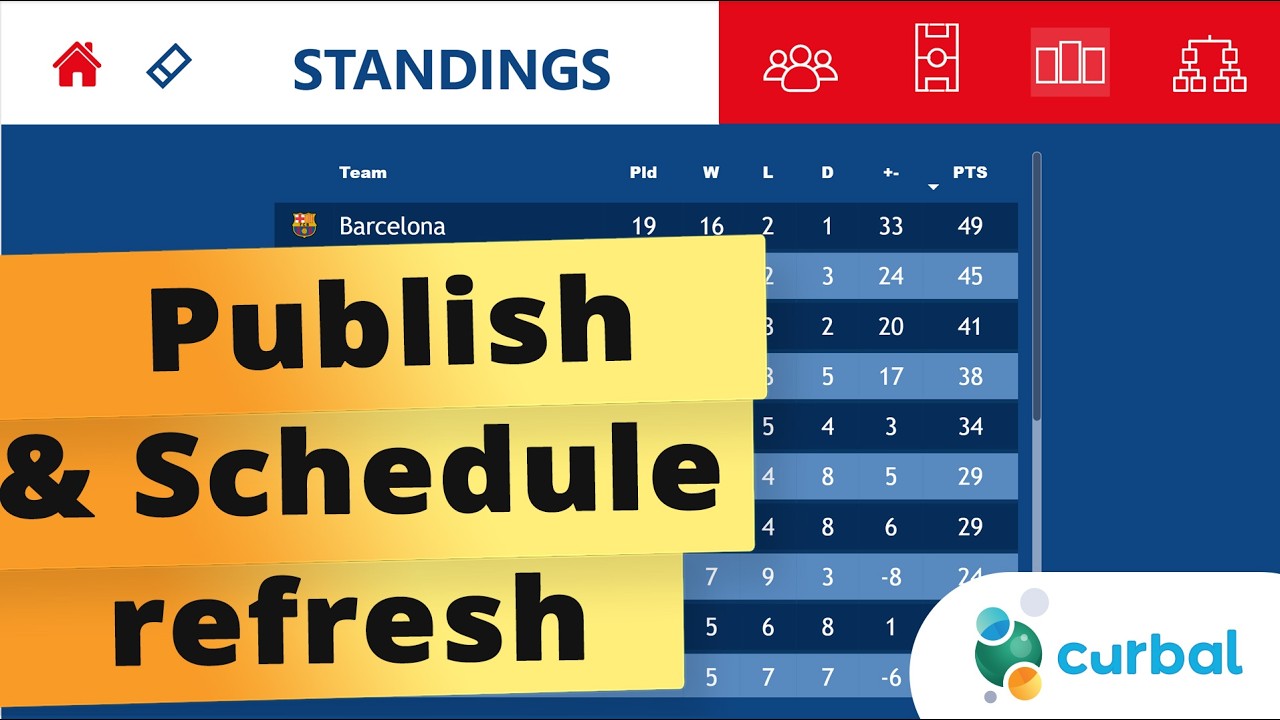
The rest of the stuff is going to be dynamic. Now, you have a bunch of stuff here. It's actually good to give it names. So, this is home. So, it's good to give names to your elements so you know where they are as, you know, the image gets more and more complicated with the background. So, I have the matches, the standings, the home. You can see there the red background, the blue background, the green. And we don't need this background rectangle anymore. Now, I am going to select everything and convert it into a frame. I think of a frame like a page, okay? So, now this is our home page. I'm going to duplicate it. This one is going to be our matches and standings. So, for this one, we don't need the image because the blue thing is going to be all the way. So, the red thing is going to actually be up here if you remember. Put it kind of there, maybe. And then put that one there. Maybe you want to see the standings first and then the matches. You choose how you want to do it. And then I have another rectangle that is going to be here white. That is where we put the title. And then I need to put the home on top of the rectangle so we can see it. So, there you go. And this is really all we need. So, now we are going to export this. We go to home and then here at the end is export and we want to export this. Make sure you pick the entire page, not elements because you can export individual elements also if you want to. Pick SVG and then export. So, here we are. Canvas. We go to home. We have La Liga. And the This is the matches and the standings. So, now we need to put this. Make it a little bit more beautiful. So, now we have the first page. We will fix the buttons and all the stuff later. We're going to put the title standings. Here matches. Gorgeous. We're going to make these a little bit smaller. Right. So, now we have everything. On the next video, we're going to do the mobile version because the cooler thing of all of these is that if we create the mobile version, we can then have it on the go. We will need to do a little bit I think we small change on the URL because I don't think we fixed correctly from the beginning. Maybe we did, I don't know. And then do the graphics, okay? So, I'll see you in the next one. Bye.