This Simple Moving Average Strategy Hit 8-1 Last Week (Day Trading)
10:50

This Simple Moving Average Strategy Hit 8-1 Last Week (Day Trading)

The Secret Mindset 30.05.2026 10 291 просмотров 424 лайков

Machine-readable: Markdown · JSON API · Site index

Поделиться Telegram VK Бот
Транскрипт Скачать .md
Анализ с AI
Описание видео
Combine this moving average trading strategy with a simple liquidity trading strategy to catch high-probability setups. Most traders fail with moving averages because they trade them in a vacuum. They see a crossover or a touch of the 50 EMA and blindly enter, only to get stopped out by institutional sweeps. This video fixes that by combining trend direction with structural traps. 
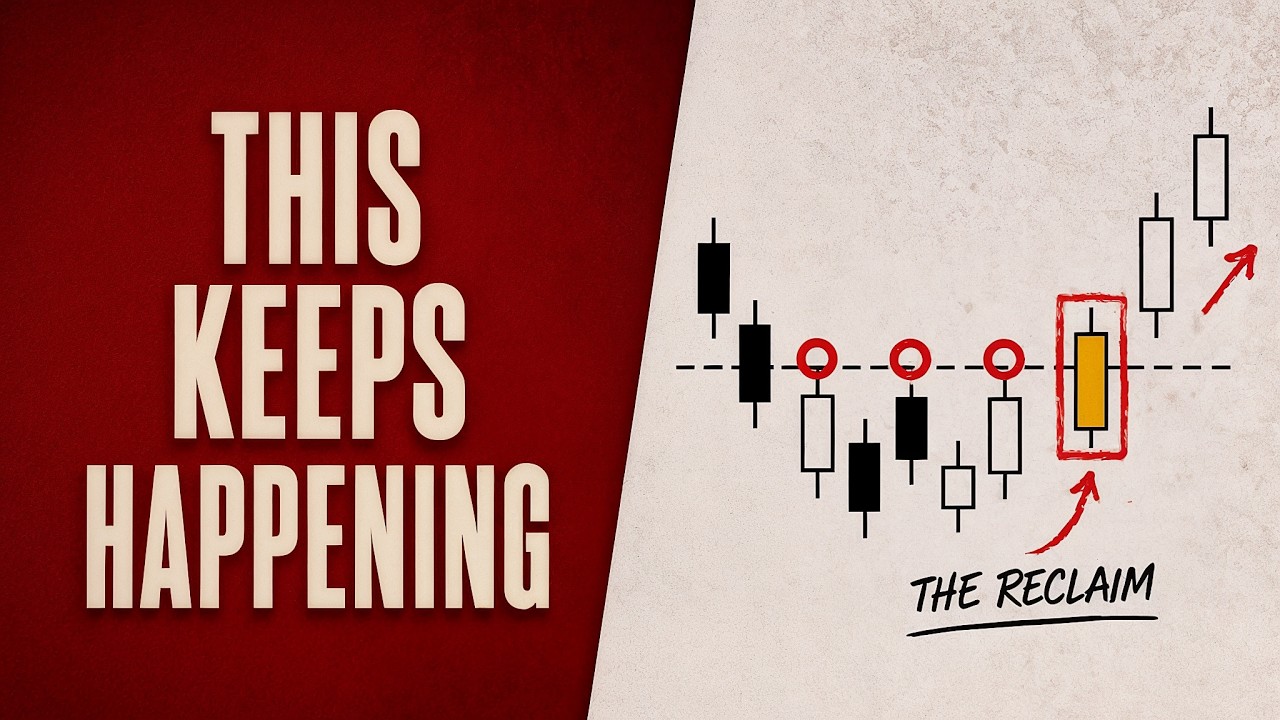
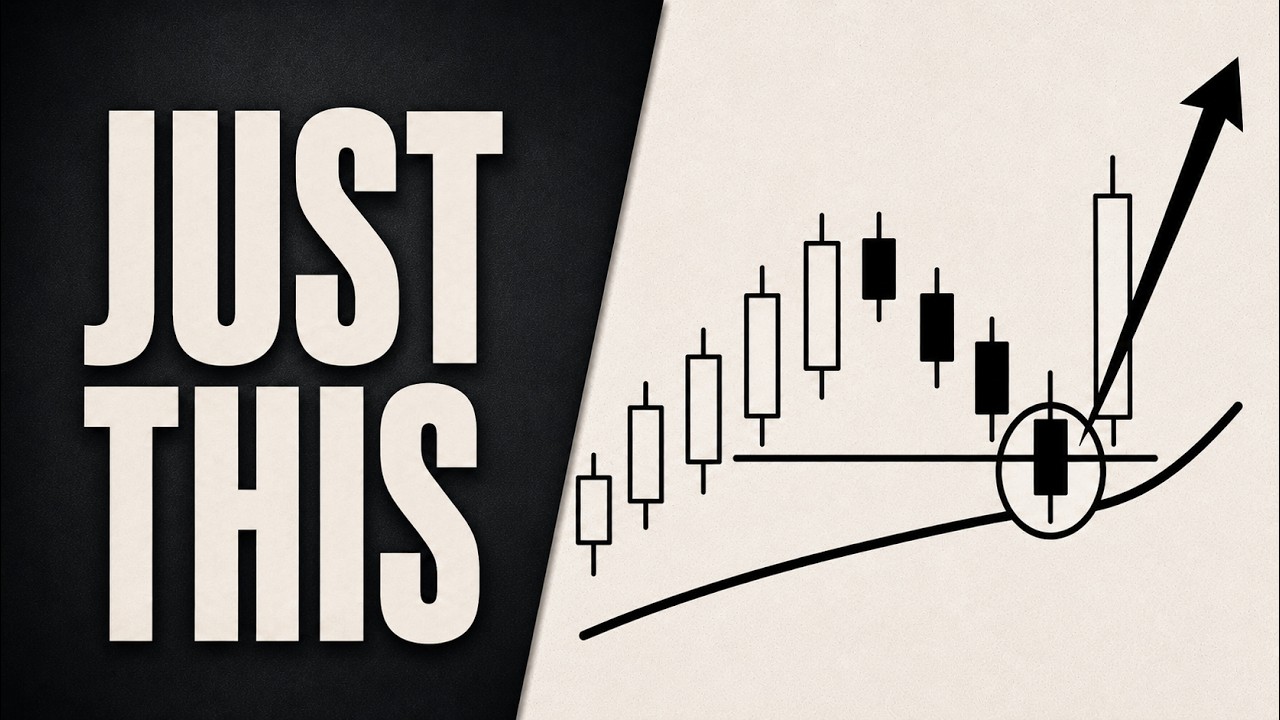
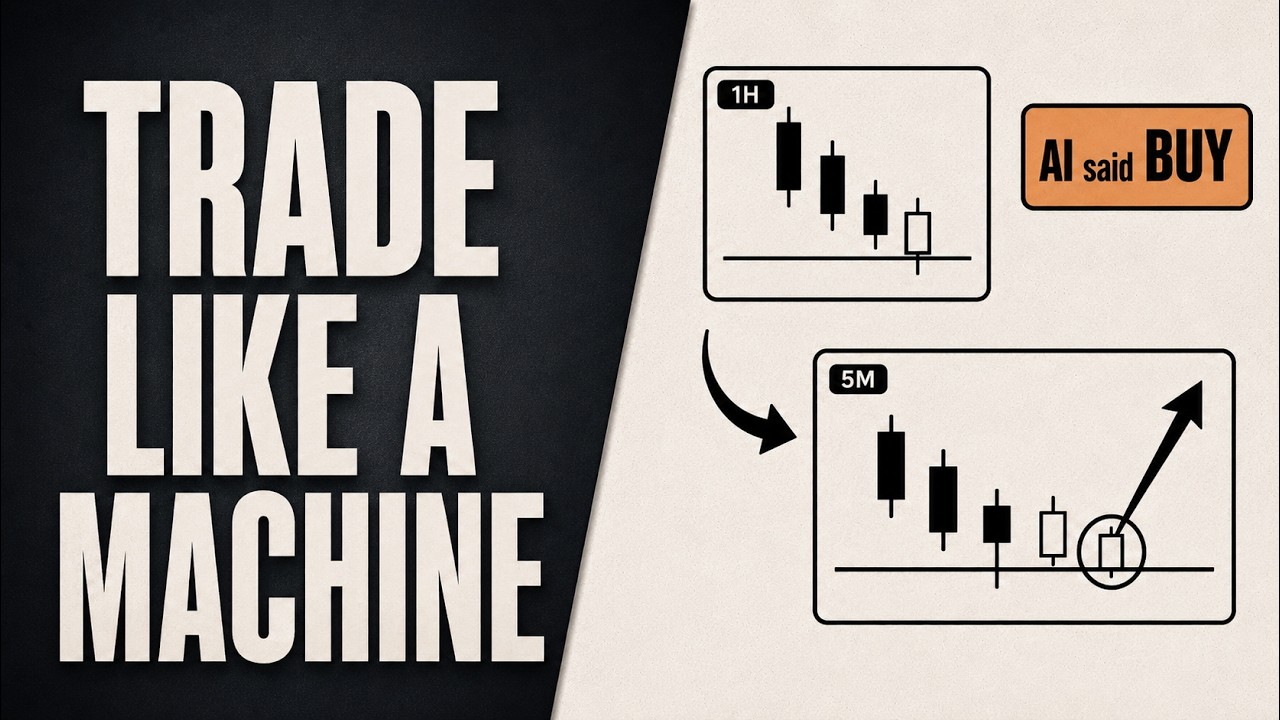
By merging a baseline moving average trading strategy with a precise liquidity trading strategy, you stop being the liquidity and start trading alongside the sweeps. We use the moving average strictly for directional bias and momentum filtering. Then, we wait for a clear liquidity sweep at a key structural level before executing the entry. 
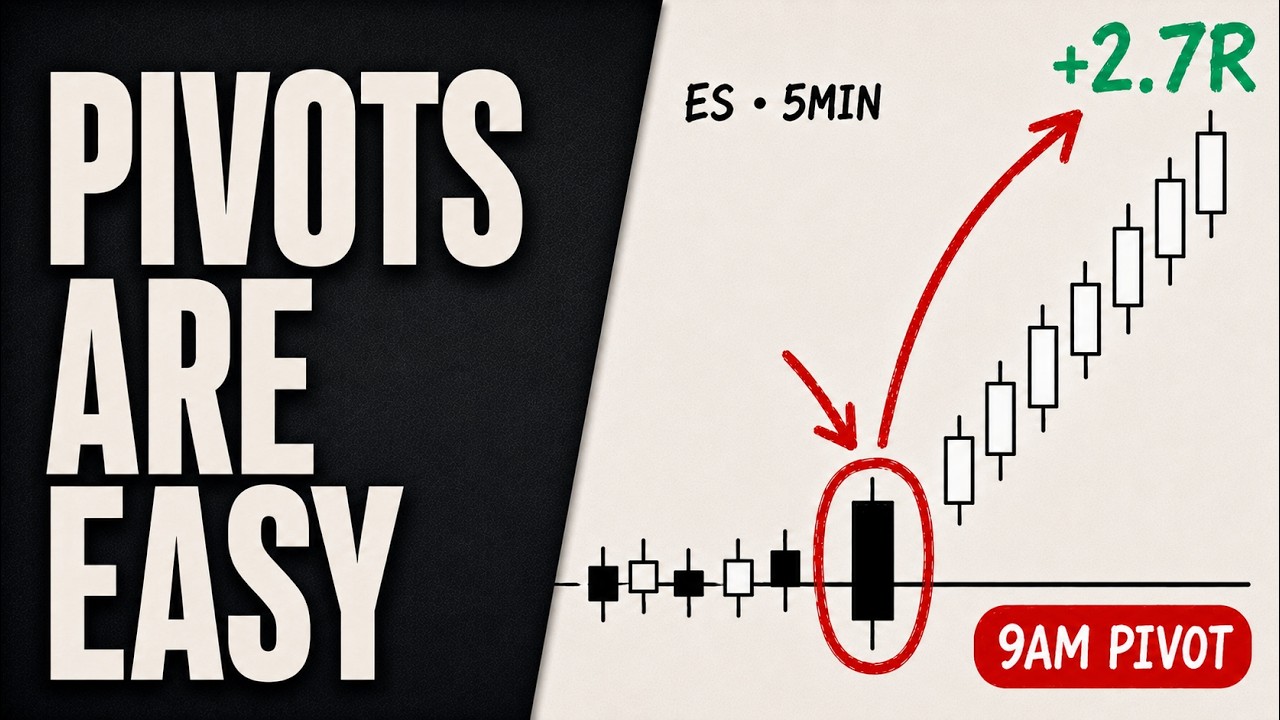
This mechanical approach removes the guesswork. You will see exactly how to frame the setup, where to place your stop loss to survive the sweep, and how to target a mechanical 2.8R without relying on hope. I will walk you through the exact rules, chart examples, and the most common traps to avoid when trading this system. ➖ ➖ ➖ ➖ ➖ ➖ ➖ ➖ ➖ ➖ ➖ ➖ ➖ ➖ ➖ ➖ ➖ ➖ ✅ Join TSM Academy: https://thesecretmindset.podia.com/academy ✅ Trade Directly In TradingView With BlackBull Markets: https://go.blackbull.com/visit/?bta=35247&brand=blackbull ✅ Best Trading Software: https://thesecretmindset.com/tools ➖ ➖ ➖ ➖ ➖ ➖ ➖ ➖ ➖ ➖ ➖ ➖ ➖ ➖ ➖ ➖ ➖ ➖ ▶ BEST Trading Courses For Beginners https://www.youtube.com/playlist?list=PLXWi52aRZnNHQltY8Yx_9dWyjLb-3X-_e ▶ Smart Money Concept & SMC Trading Strategy https://www.youtube.com/playlist?list=PLXWi52aRZnNEenm94OvraMdq90_7uj5wo ▶ Price Action Trading Strategies https://www.youtube.com/playlist?list=PLXWi52aRZnNHkXSeG7E213pkSDayGp0HD ➖ ➖ ➖ ➖ ➖ ➖ ➖ ➖ ➖ ➖ ➖ ➖ ➖ ➖ ➖ ➖ ➖ ➖ RISK DISCLAIMER: This content is for educational purposes only. It is not financial, legal, or tax advice. Trading involves a high level of risk and is not suitable for all investors. Past performance is not indicative of future results. You are solely responsible for any investment decisions you make. Before investing, consult a licensed professional. We assume no liability for your trading and investment results. AFFILIATE DISCLOSURE: Some links may be affiliates. If you purchase through them, we may earn a commission at no extra cost to you. We only recommend products we have vetted and believe will provide value.

Оглавление (3 сегментов)

Segment 1 (00:00 - 05:00)

This moving average strategy only works after  the market tricks the wrong traders first. But the second you apply this  one hidden liquidity rule,   it turns into a system that  averages 2. 8R per trade. You already know the moving average breakout. Price breaks above, and you go long. It breaks below, and you go short. You have seen it work in every textbook example. But here is what those textbooks do not show you. Watch this. Price breaks below the 50 moving  average during a clear uptrend. Retail traders see this candle and panic-sell. It looks like the trend is ending. Now watch what happens next. Price immediately reverses. It rips back above the line. It keeps climbing in the original direction. Every short is now trapped. Their stops are triggering  above the moving average,   and the momentum from their exits  is pushing price even higher. This is not a random failure. This is how the market is designed to work. Only about 15 to 20% of moving average breakouts  actually play out like the textbooks show. The other 80% look exactly like what  I just showed you: a liquidity trap. The moving average breakout  does not fail randomly. It fails by design. Let me explain. Here are the mechanics of the trap. When price is trending up above the 50  MA, where do most traders put their stops? Right below the moving average. Because if price breaks below it,  they think the uptrend is over. And when price is trending down below the  50 MA, stops are clustered right above it. So you end up with this situation. Both sides of the moving average have  orders stacked up, waiting to be triggered. And big players know exactly  where those orders are sitting. Watch this. Price is moving down, sitting  below the 50 moving average. Shorts are stacked up, and their stops are  all clustered above the moving average. Now watch. Price spikes above the MA. Those stops trigger. The buying from those stop outs  creates a brief surge higher,   but there is no real conviction behind that move. It is just stop orders getting hit. And the moment that wave of buying is  absorbed, price reverses right back down. Then it continues the original trend even harder. That spike above the line was not a trend change. It was a liquidity grab designed to trap  traders and fuel the next leg of the real move. Once you see this pattern,  you will notice it everywhere. And instead of getting trapped by it, you  can position yourself on the right side. Here is exactly what I need to  see before I take this trade. First, the trend has to be obvious. I mean really obvious. Higher highs and higher lows  that are crystal clear for longs. Lower highs and lower lows  with no ambiguity for shorts. If I cannot see the trend in  three seconds, I do not trade it. Next, I need a brief break of the 50 MA. And I mean brief. I look for one to three candles. If it lasts more than five  candles, I usually walk away. We want a panic dip, not a new trend. Watch this. Price dips below the line, sits there for  two candles, then snaps right back above it. That is the pattern I am looking for. If price breaks the MA and stays on the  wrong side for more than five candles,   that is not a false breakout. That might be a real trend change. I am looking for quick fakeouts  that trap traders and reverse fast. Now, here is the confirmation  that tells me the move is fake. Volume. When I check the volume on that breakdown,  it should be lower than average. Real breakdowns have conviction behind them. Lots of traders are piling in. Big volume bars appear. Fake breakdowns are quiet. The volume bar is smaller. Nobody is actually committing to this move. And the last piece is the  strongest signal I can get. A liquidity run. Watch this. Price does not just dip below the line. It goes further and takes  out this previous swing low. See that level? That is where traders had their stops. The market just swept those stops, ate them  for breakfast, and now it is ready to reverse. When I see a liquidity run combined  with the other three pieces, an obvious   trend, a brief break, and low volume,  I take that trade with confidence.

Segment 2 (05:00 - 10:00)

Let me show you exactly how I pull the trigger. Once all four pieces are present,   I wait for price to cross back to the  correct side of the moving average. In an uptrend,   that means waiting for price to close back  above the 50 MA after the false breakdown. That candle close is my entry signal. In a downtrend, I wait for price to close  back below it after the false spike higher. My stop goes just beyond the liquidity sweep. If price took out a swing low during the  trap, my stop goes right below that low. It is a tight stop, but it is protected  behind the level that already got swept. For targets, I am looking at the next significant  structure level in the direction of the trend. Previous highs in an uptrend. Previous lows in a downtrend. This usually gives me at least 2R, often more. Let me walk you through real examples so  you can see exactly what this looks like. Gold has been climbing steadily. The 50 moving average is  rising right along with it. Higher highs. Higher lows. Obvious structure breaks to the upside. Now watch this move. Price dips below the 50 moving  average for just a couple of candles. Check the volume. It is surprisingly low for  what looks like a breakdown. And see this level here? Price swept right below it. It grabbed that liquidity. All four pieces are here. Obvious trend. Brief break. Low volume. Liquidity run. When price closes back above  the line, that is my entry. Stop below the liquidity sweep. Target at the next resistance level. Look what happens. Price reverses and pushes all the way back up. The traders who shorted the breakdown get crushed. Their stop outs help fuel the rally. Second example. An index in a downtrend. Price has been falling for the whole day. Lower highs. Lower lows. Multiple structure breaks to the downside. Then this happens. Price spikes above the 50 moving average. It looks like a reversal, but check the volume. It is lower than average, with no real conviction. And watch this level here. Price runs right above it before reversing. That is a liquidity sweep  trapping breakout buyers. When price closes back below  the line, that is your signal. Stop above the liquidity run. Target at the next support. And look at that. The breakout was a complete trap. Now, here is another uptrend. Higher highs. Higher lows. Strong momentum to the upside. Price is respecting the 50 MA as dynamic support. Now, this is a quick nosedive  below the moving average. Price even takes out this previous swing low. That is the liquidity run. And check the volume during this drop. It is notably lower than  the average bars around it. Classic false breakdown. You know the setup by now. When price closes back above  the 50 line, that is the entry. Here is another one. A forex pair in a downtrend. I just want to show you that this liquidity  sweep strategy works across most markets. There is a prolonged downward trend. Price is staying below the 50  moving average consistently. Then comes this spike higher. Price briefly pops above the moving  average and sweeps this level here. Volume is low. Duration is three candles. And the liquidity run is clear as day. When price drops back below  the line, your entry is valid. Notice how the market continues its initial trend   and accelerates even harder  after the trap is complete. You have now seen this pattern  across four different markets. The setup works the same way every time. That is what makes it reliable. But please do not force the setup. This liquidity pattern shows up a few  times per day across the markets I watch. If all four pieces are not there, I do not trade. Obvious trend. Brief break below the moving average. Low volume. Liquidity run. Period. The best setups are obvious. If you are squinting to see it, it is not there. And one more thing. If volume is heavy on the breakout, be careful. That might actually be a real  trend change, not a trap. Light volume is your confirmation  that the move is fake. And remember, brief means brief.

Segment 3 (10:00 - 10:00)

One to five candles against the  moving average, then reversal. If price stays on the wrong side for an extended  period, the trend might actually be changing. Again, do not force it. Here is what I want you to do right now. Open your charts. Pull up the 50-period moving average. Find the false breakouts from the last few days. Check the volume. Look for the liquidity sweep. See how the trade would have played out. If you can spot them easily,  you understand this strategy. If you want to go even deeper on  liquidity hunting, I break down   the advanced concepts in this video right here. That is your next step. And if you are ready to fit this  into a full A-to-Z trading system,   that is what our academy is for.

Другие видео автора — The Secret Mindset

Ctrl+V

Экстракт Знаний в Telegram

Экстракты и дистилляты из лучших YouTube-каналов — сразу после публикации.

Подписаться

Дайджест Экстрактов

Лучшие методички за неделю — каждый понедельник