Printf, variable monitoring, debugging, and more using the serial wire trace output (SWO).
Limited-time: $2 for 6-layer PCBs up to 100×100 mm - grab your $33 coupon now: https://jlcpcb.com/events/6-layer-pcb?from=PhilsLab (Ad)
OSHWLab Stars 2026: https://oshwlab.com/activities/stars2026
Altium Develop: http://altium.com/yt/philslab (Ad)
[SUPPORT]
Hardware design courses: https://phils-lab-shop.fedevel.education
Course content: https://www.phils-lab.net/courses
Patreon: https://www.patreon.com/phils94
[LINKS]
SWO Basics: https://black-magic.org/usage/swo.html
[TIMESTAMPS]
00:00 Intro
01:46 JLCPCB (Ad)
03:21 Altium Develop (Ad)
04:26 SWO & HW Overview
07:31 CubeIDE Set-Up
09:03 ITM Port & SendChar
12:12 printf via ITM
13:14 Enabling SWV
16:04 Multiple ITM Ports
18:34 DWT Comparator Variable Monitor
22:44 Outro
Оглавление (11 сегментов)
Intro
In this video, I'll show you how to use serial wire output, SWO for short, with the instrumentation trace macrocell, ITM for short, and data watch point and trace, DWT for short, to debug and monitor your firmware on an embedded system, in particular on ARM Cortex microcontrollers. In this particular case, we'll be using an STM32H7 managed on this custom PCB called the Queen Bee radio control PCB, which we've seen a couple times previously on this channel. The nice thing about using SWO for debugging or monitoring and plotting is that we don't need UART or USB CDC virtual comport, for instance, meaning less peripherals to use, less pins, and so on. We're just using our existing serial wire debug connection with an additional single extra trace pin, this SWO pin. This is a simpler, sometimes better way of debugging and monitoring that's really built into most ARM Cortex microcontrollers, such as the one we'll be using in this video. SWO, serial wire output, lets you stream print F messages and live variable data through a single dedicated trace pin using the two hardware blocks inside the Cortex microcontroller. Again, the ITM for software-driven print F and data output, and DWT for automatic hardware-based variable monitoring. If you have an ST-Link V2 or V3 or different debugger, such as the Segger J-Link, you can follow along with this video, and many other debug probes offer this functionality. Again, I'll demonstrate this using this particular board, the Queen Bee radio control PCB, which is a custom design with an STM32H7 microcontroller, which also has the SWO trace pin broken out to this six-pin Tag-Connect solderless debug header. Just for the sake of demonstration, I'll also be hooking up an ADC to monitor these thumb sticks, which you can then stream through the SWO trace pin. I hope this video proves to be useful for your own embedded systems needs, and shows you a different and very helpful way to help you debug your embedded systems. A
JLCPCB (Ad)
huge thank you to JLCPCB for sponsoring this video. I have most of my PCBs manufactured at JLCPCB, and they always do a fantastic job. In particular, I would like to shout out their high precision six layer PCB service. Six layer PCBs give you access to more routing layers of course than two or four layers, increases your routing efficiency. You can have dedicated ground and power planes on extra signal layers giving you faster development cycles, cleaner design and fewer redesigns typically. JLCPCB helps us out as designers because of an unbeatable price. For instance, for a six layer PCB 50 by 50 millimeters, we can get them right now at $2 for five pieces and this includes an immersion nickel gold service finish. We can specify impedance control and we get epoxy filled and capped vias as a standard so we can do via in pad again just for $2 for 50 by 50 millimeter PCBs. They're also very efficient and very quick to manufacture the PCBs. Often times I can have my PCBs back in less than two weeks and this is also with assembly. Also at the time of making this video, EasyEDA and the open source hardware lab with manufacturing support from JLCPCB is running the OSHW Lab Stars 2026 open source PCB design competition. This contest focus on the full journey of design, prototyping, real world applications and then open source sharing. They have prizes up to 85,000 total in cash, material and shipping support from JLCPCB and a $100 JLCPCB coupon for every completed project. Also the top creators are invited to the open source hardware lab stars conference in 2027. I'll leave a link to this in the description box below. Make sure to check it out and join if you want to. A huge thank you
Altium Develop (Ad)
also to Altium for sponsoring this video. I use Altium Developer which includes Altium Designer and Altium 365 in my everyday day-to-day work life as well as for creating content for this channel and I also use Altium Designer as part of Altium Developer to design and manufacture this digital audio processing board that we'll be seeing and using in this particular video. Altium Developer enables multi-disciplinary teams to design, develop and manufacture high quality hardware products with ease and efficiency all the way from co-creation of designs be that parts library management, schematic design, hardware design, requirements management, all the way through managing your supply chain, manufacturing, and of course, generating and maintaining all of the relevant data as part of an entire project. You can take a tour of Altium Designer, and I'll leave links to this in the description box below, which guides you through all of the parts that Altium Designer helps you manage in your project and product design process. If you're interested, again, I'll leave links in the description box below, but you can get started with Altium Designer, and you can try this out for yourself risk-free for 30 days. Links will be in the description box below. Before we move
SWO & HW Overview
over to implementing serial wire output, or SWO for short, as well as the instrumentation trace macrocell, or ITM for short, on an STM32 microcontroller, let's briefly go over what these actually mean, how they could be helpful, in particular when it comes to debugging embedded systems and microcontrollers. I'll leave links to these two technical references in the links in the description box below, but as a brief overview, serial wire output, or SWO, is an additional debug pin, in addition, for instance, if we're using serial wire debug, where you have the data and clock pin, we have an SWO pin, which we can use as an output for more extended debugging and logging. For instance, rather than using a UART or USB connection to a terminal, we can use the serial wire output on a single line that connects to the debugger to have a very similar function to a UART, that's printing debug messages, monitoring live variables, and so on. SWO is typically available on Cortex-M3, M4, M7, and some of the newer M33, M55 cores as well, but some of the Cortex cores do not have this. In addition to SWO, which is the actual physical output pin integrated in a number of the ARM Cortex cores is the ITM, again, the instrumentation trace macrocell, and that is the actual peripheral within the core that generates this trace data. Again, SWO is just a physical output. The nice thing about serial wire output, and why we want to use that, if your microcontroller has it, is that, again, it doesn't need a UART to be rooted out and only requires a single additional pin. If you're using STM32 microcontrollers, you can use the relatively affordable ST-Link/V2 programmers. They support SWO as well as the a newer ST-Link/V3s. There are many other debug probes that will actually also support SWO. I'm in this case using a Segger J-Link, but the principles are the same for this particular SWO across debug probes. In terms of the hardware, the board we saw the beginning of this video is what we're going to be using for this particular demonstration for SWO. I'm using an STM32H7 microcontroller on this PCB and I've routed out serial debug, serial wire, clock, ground, and power connections to a Tag-Connect TC2030 solderless debug header. Zooming into the pin out, we can see I have got my usual data IO, I've got my clock, I've got ground, a reset signal, and power for my voltage reference, but I also have this additional pin, this trace pin or SWO pin. And this also routes into a dedicated pin on my microcontroller. And there's, if your microcontroller has this functionality, there's always going to be a fixed dedicated pin. If you're using serial wire debug, that is similar to the TDO pin on the JTAG interface, but we're using serial wire debug in this case. Other than, of course, the microcontroller, the peripheral circuitry to get this microcontroller to boot and up and running, and of course, our debug connection using SWD, plus of course, the trace output, I would like to just wire up some other peripherals that I have on this board. In particular, I've got these two thumb sticks, left and right, which will take four ADC channels that we can route into our STM32 microcontroller. And just so we have something then to just stream via the SWO pin and the ITM interface that we can then display in a viewer, just to demonstrate. But of course, you can use this with any type of data, if it's log or debug information, if it's to monitor live variables, and so on.
CubeIDE Set-Up
In CubeIDE, let's just go through the actual config of this part. This is the STM32H7 microcontroller that's soldered onto the screen B radio control PCB. The main connections I have, if I go to the left-hand side to trace and debug, if we go to debug, the normal option we would choose if we don't want SWO, it's just serial wire. That just enables the serial wire data and serial wire clock pins. But, if we go to trace asynchronous, that also enables this third pin, SWO. So, we have PA13 SWDIO, that's the data input output, and serial wire clock enabled. But, if we look at pin PB3, that's now also SWO. This is the trace output. That's the one we want to use that the interface is also with the debugger. Other than that, I have just set up I've got a 26 MHz CMOS oscillator as my clock input, and I set up four ADC channels, which are my thumb sticks, thumb stick left X and Y, and thumb stick right X and Y, just so we have something to stream via our SWO output. In terms of clock configuration, this is important because we need to know the core clock when we're using the serial wire viewer or the serial wire output. The debugger needs to know what our core clock is running at and what it can then run the SWO output at. I have my input frequency of 26 MHz, again using the high-speed external crystal or CMOS oscillator in my case, and I'm running the core at 480 MHz. The ADCs I've configured as per usual just via DMA and a specific sampling timer, but you can see I've not enabled any of the other peripherals, so no UARTs, no USBs. We're going to do everything, all of our output, through the SWO pin and the ITM.
ITM Port & SendChar
With our Cube IDE code now auto-generated, we end up with our usual project structure. The first thing I'd like to show you is how you can use the ITM and SWO output to replace the printf function, or rather to reroute the printf function not to a UART or not to a USB CDC virtual comport. We want to go through the ITM, through the SWO output, through the serial wire output, into our debugger, and then use our debug interface then for instance as a console or to plot live variables. One function that the ITM provides is the ITM send character function. If I control click into that, and can see this is opened in the core underscore cm7 header file. So, this is particular to the cortex m7 core. And this function tells us quite a bit about the actual ITM behavior. We can see the ITM send character function takes a single character, checks if the ITM is enabled, checks if a particular port, in this case port zero, is enabled, waits until there's no data in that particular port, and then just sends out the character on that particular port. If we go a bit deeper, the ITM stimulus ports, there are actually 32 of these ports. If we hover over that, we can see there's 32 ports. And these 32 ports can be active simultaneously. Essentially, the ITM multiplexes the data from these ports onto the single SWO stream that's then outputted onto the single data line that we saw in the hardware configuration. Then on the other end, through the debugger onto our receiving end, receiving tool if we're using the built-in functions in QID, which we'll see later on. So, that's the serial wire viewer and so on. That then converts that or demultiplexes all this port data, these up to 32 channels that are multiplexed onto the single SWO line, and we can display each of these ports separately. This also means that, of course, the total bandwidth is shared across all of these ports. It's just one physical pin on the hardware. So, if you have more ports active, you have to share that overall bandwidth. This particular ITM send character function happens to use port zero. So, if we're mapping this to printf, as we'll see later on, you would use for your other variables, if you want to plot live variables or if you want other mapped functions, you would use different ports other than port zero. Keep in mind, we still have 31 other ports available to us. What you might have also noticed is that the port has various support for different data widths. If I control click on the port, we can see we have data width of 8 bits, 16 bits, and 32 bits available to us. And you can choose that. You don't have to set up the port fixed to 32 bits or fixed to 8 16 bits. You can actually do that on a per transfer basis. All you would have to do to send data via the SWO link, assuming, of course, it's enabled, is simply write, as this ITM send character function is doing here, to the relevant port width entry. So here we're just writing the character to the unsigned 8-bit width port entry. So if you want to send a floating point, we just cast our floating point to UN32 and then set the UN32 part of our port, whatever port index we're sending on, to that casted float, for example. So this means the mapping is entirely software defined, but again keep in mind this send character function automatically maps to port zero. Again, we'll be using that for printf later on. So nicely enough, you could have printf on port zero, you could have ADC values on the ports above that, and whatever you want to send. And we'll see later on how to then also enable these various ports, and the ITM is actually enabled automatically for us by enabling the SWV and then enabling the SWV viewer.
printf via ITM
So now let's implement the actual printf remapping and using this ITM send character function. In the user code section above int main in main. c, I'm just going to paste this pretty standard code in, and you'll find that in pretty much every resource, this is the standard implementation. The write function is effectively a prototype or weak prototype that the printf function will call to output characters onto a stream. So you could remap that to UART, USB CDC, and so on, but in our case, we are remapping the write function to simply call the ITM send character function. Printf is just a stream of characters, and we are sending them one by one to the ITM and the ITM send character function. And ITM send character function, as we just saw, will wait till the ITM port is cleared, place in the next character, wait till it's cleared, and so on, every time we call the send character function. For printf, we need to include standard io. h, and once that's been included, then in my main while loop, just as a simple demonstration, I'm calling printf and just writing a random string of characters terminated by a carriage return and new line, and just delaying by 500 milliseconds.
Enabling SWV
Then I can build this program. I've have my debugger attached. I'm using a Segger J-Link Ultra Plus. Again, this has capabilities and support for SWO. Then, before we hit debug, we would to debug configurations, and for the debug configurations of this particular project, I would go to debugger, choose my relevant debug probe, if that's an ST-Link or if it's a Segger J-Link. I'm using a serial wire debug, but what's important for us is also to enable the serial wire viewer. We need to enable that if you want to use the SWO features and actually access them. You can click enable. And remember earlier we were talking about the clock tree configuration and that we need to know the core clock that we're running at of the device when we're using SWO. That's what we need to enter here. I'm running at 480 MHz in this particular example, but that needs to be tailored on whatever your core clock is in your particular scenario. You have the option to limit the serial wire output clock. If you uncheck that, it'll just auto-detect what the maximum serial wire output clock is in kHz, so that's fine to leave unchecked. And port number is fine to leave like so as well. Now I have my device powered and my debug probe connected. Let's click on debug. We've hit the first breakpoint as usual in main, so just on the first line in main. Before we continue, let's open the data log panel and the ITM and SWO config. To do that, go to the top window, show view, then SWV. This is the serial wire viewer entry. We have got a few different examples. For now, I'm just going to open the ITM data console because we're using the printf functionality, so I'm going to click on that. Then on the right-hand side, you can see this little tool icon to configure the trace. Let's open that. From that, we can see the core clock, the clock prescaler, and what we get out as our SWO clock. And that's about 48. 5 MHz in this particular case. And we're having this auto-calculated. This is a fairly fast SWO clock based on our core clock. What we want to enable now is port zero. Again, we have up to 32 ports, so zero through 31, and we know that our ITM send char is using ITM port zero. So I'll click on port zero, then click okay, and now we also want to enable or start recording or start the trace with the little record button next to the tool button, start trace, then click run or resume, and then moving out to the SWV ITM data console, we can see our SWO test is being printed out exactly like we have written in our main while loop, delayed by 500 milliseconds every time. So, every 500 milliseconds, we're getting this print F remapped through this weak function redeclaration, mapping our print F send character function to the ITM, which again uses port zero and writes an 8-bit wide character to port zero. So, in this way, you don't have to have a UART, a USB CDC virtual com port, or any other way of using a print F, and you could for instance write your debug functions to use the SWO output. But, this is only one use case for this. We can of course use the other ports to, for example, plot or log live variables as well. Now
Multiple ITM Ports
if you want to use the other ports, I've just made a very simple demo of how we can access those and how we can essentially do the same thing as the print F function is doing, but rather than writing to port zero, we're writing to an arbitrary port. This is where I've just written this ITM print port function, which just takes what we saw in our ITM send character function, but we can use different ports. So, we're checking if the ITM is enabled, and certain port we're accessing is enabled. Keep in mind, this isn't checking if it's between zero and 31. But, in any case, it then loops through a string, so a character buffer, checks if the port is ready to write to, and then writes the next character in that character buffer to the port, assuming of course the character buffer is null-terminated. We can then use that function to write to ports, and the reason I'm actually writing a character a buffer or string is because the viewer built into STM32CubeIDE essentially expects ASCII characters rather than integers. So, what I'm then doing, I've implemented all the ADC functions around it. For our sakes, it's not important how they're set up, but I'm using print F to print the current timestamp in milliseconds, and then I'm looping through my ADC channels and using my newly generated ITM print port function on ports, starting at port one, because again, port zero in this case is being used by print F, and from port one, two, three, and four, I'm sending out what's currently on my ADC channels as just a string of text. After that, I'll then show you how to you can actually do live variable plotting without doing any of this manipulation. I just wanted to show you this how you can access other ports other than port zero. And it's very straightforward. You can of course just pretty much directly write to whatever port you want. So, all I have to do is click on debug. Then in my ITM data console, if I go to configure trace, I've enabled not just port zero, which was for my print F remapping, but 1, 2, 3, and 4 for my four ADC ports that I'm using now. If I click okay and then click run, we can see every second approximately I'm getting my timestamp and port zero again is just used by print F. And on port 1, I'm getting my ADC reading. If I move my thumbstick around, we can see I'm getting different readings there as well. As I move it around, port 2 is my second ADC channel. Again, I can move my thumbstick around, port 3, and port 4. And these are using essentially the same structure as print F. Just sending an array of characters or a string. So, this is one way to we could do it if we want to send different ASCII characters. Again, this is because this ITM data console essentially just shows the ASCII equivalent. But if you just want to read the raw variables, of course this is rather superfluous. This is a bit too much using all these various functions if we just want to monitor the variables. The code previously was
DWT Comparator Variable Monitor
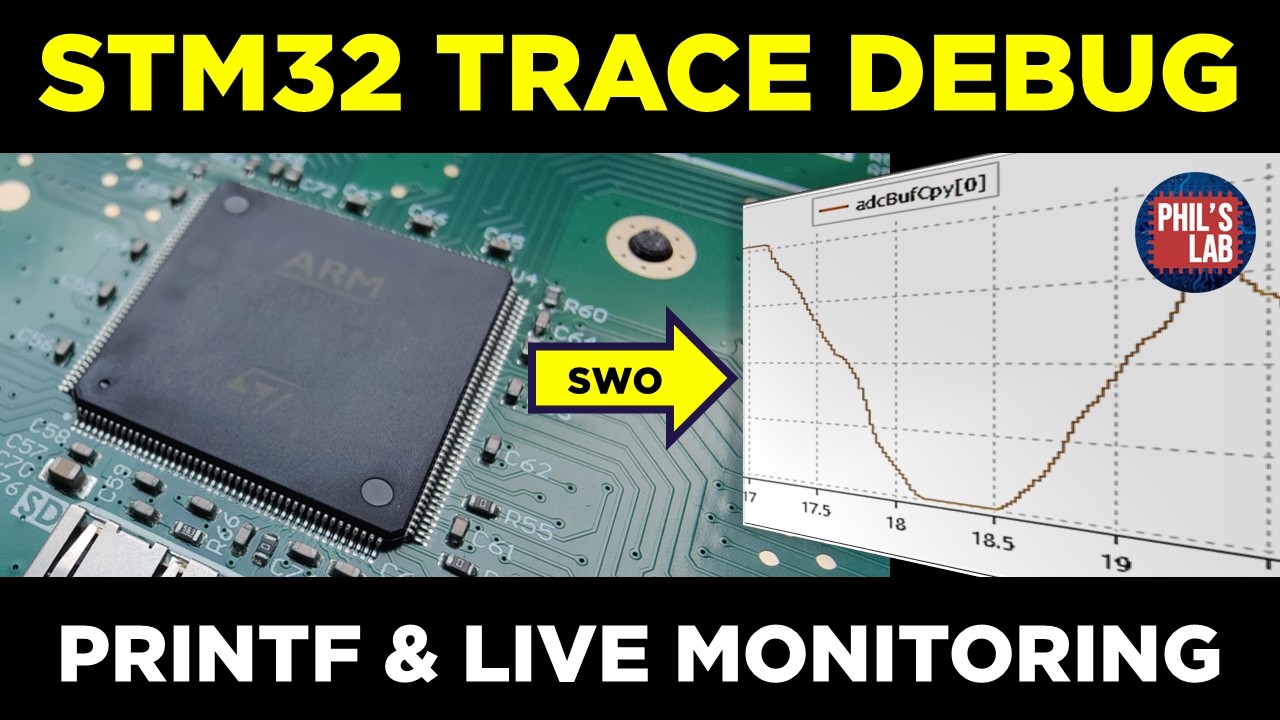
rather convoluted converting to strings, sending out buffers. What if we only want to monitor actual live variables or plot them on a live graph? Well, there's an easier way of doing that, kind of bypassing the ITM but still using the SWO. But in this case, we will actually be using the hardware comparators that are typically available in the data watchpoint and trace unit or the DWT in Cortex microcontrollers. For that, essentially we just need to have the address of what variable we want to look at and where we want to plot or monitor. In this case, however, I am using DMA and DMA can sometimes interfere with this. So, what I've done, I have my normal ADC buffer, but I'm also have a copy of that buffer. So, anytime data is ready, I'm just copying my DMA buffer into a different buffer copy and will actually just be monitoring the buffer copy so rather than the directly filled DMA stream because the DMA, of course, for the most part bypasses the CPU and the CPU is actually what triggers the data transfer. So, the code I've done now is I've started my ADC DMA streams with a sampling timer that sets an interrupt if ADC conversion's complete. We check the flag in the main while loop, clear the flag, we copy our DMA buffer into a different working buffer, which we then monitor. And I'll show you how to do that in just a second. And just for the sake of it, I also have just a printf function going periodically every second to see how many ADC conversions have completed and that's stored using the ITM port zero. So, let's see how to connect this up. I'm going to debug as usual. Then, in window, I'm going to go under show view, SWV, and we still have our ITM data console as before. That's for the printf, but separately, we want to go to window, show view, SWV, and we want to show the data trace timeline graph. And this is actually separate to the ITM. Again, to see that, let's go to the config on the right-hand side. And what appears is our usual window. At the bottom, we have our ITM stimulus ports. So, for port zero because we're setting the ports directly via the ITM via the printf function, we want to enable port zero. That's for printf, but separately, we can see here we have these four comparators. And this is part of the DWT. Typically, we have four comparators for Cortex M4 and Cortex M7 cores, and they can be less for different cores. We can already see we only have four comparators here compared to the 32 ports we have for the ITM. The difference is, however, the comparators are very useful to automatically trigger hardware SW outputs whenever a variable changes rather than with the ITM stimulus ports, we actually have to write in software, "Okay, now send on the port. " The comparators watch for a memory value of a at a certain address. So, if I enable comparator zero, my first comparator, I can simply type in the memory address. So, that's ADC buff copy, the first index of that array. Now, keep in mind, these variables have to be global, or they have to be statically declared within a file, so that the serial view can actually find the address of these. It'll also automatically figure out the size. So, again, comparators part of the data trace are separate to the ITM ports. In this particular example, we're just enabling both, but if you just want to use the comparators, you don't have to enable any of the stimulus ports. So, now I click okay, and we can click run. In the data console, this is the printf routed via the ITM send character function. This is periodically every once per second, every second, showing us the number of conversions that have been completed since the start of this program. But, separately, we have this SWV data trace timeline graph. So, again, you can go to window, show view, SWV data trace timeline graph. This, again, is separate to the ITM. This uses the DWT. Now, in the SWV data trace timeline graph, I've got my joystick currently stationary, but we can see we're looking at the ADC buff copy index zero. And we can see that's updating live and being plotted. Now, if I move my joystick, we can see in real time, we can plot variables and data. So, I pause the program, the timeline graph and the data console stops as well. So, when the core is halted or paused, then we don't get any transfers. Keep in mind, the ITM and DWT are, of course, multiplexed on the same SWO pin. So, there's going to be bandwidth constraints, regardless if you use the comparators, or ITM stimulus ports. But, they are different ways of achieving different things, depending on what your needs are. Both are very useful. Thank you
Outro
very much for watching this video. I hope it was useful, and I hope it showed you the basics of using the serial wire output connected to your debugger, along with ITM and DWT units available on most Cortex microcontrollers. If you like the video, please leave a like, a comment if you have any questions, and don't forget to subscribe to stay up-to-date with any latest PCB, hardware design, and embedded systems videos. Thanks again for watching, and I hope to see you in the next one. Bye-bye.