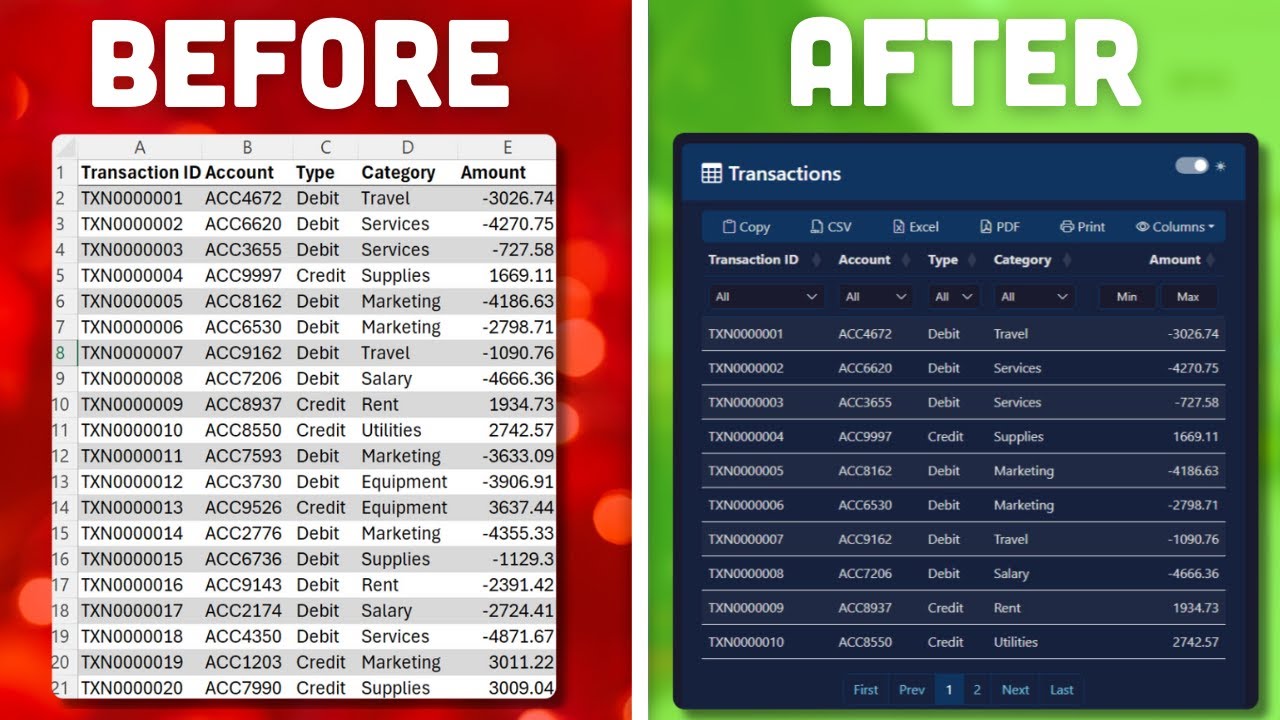
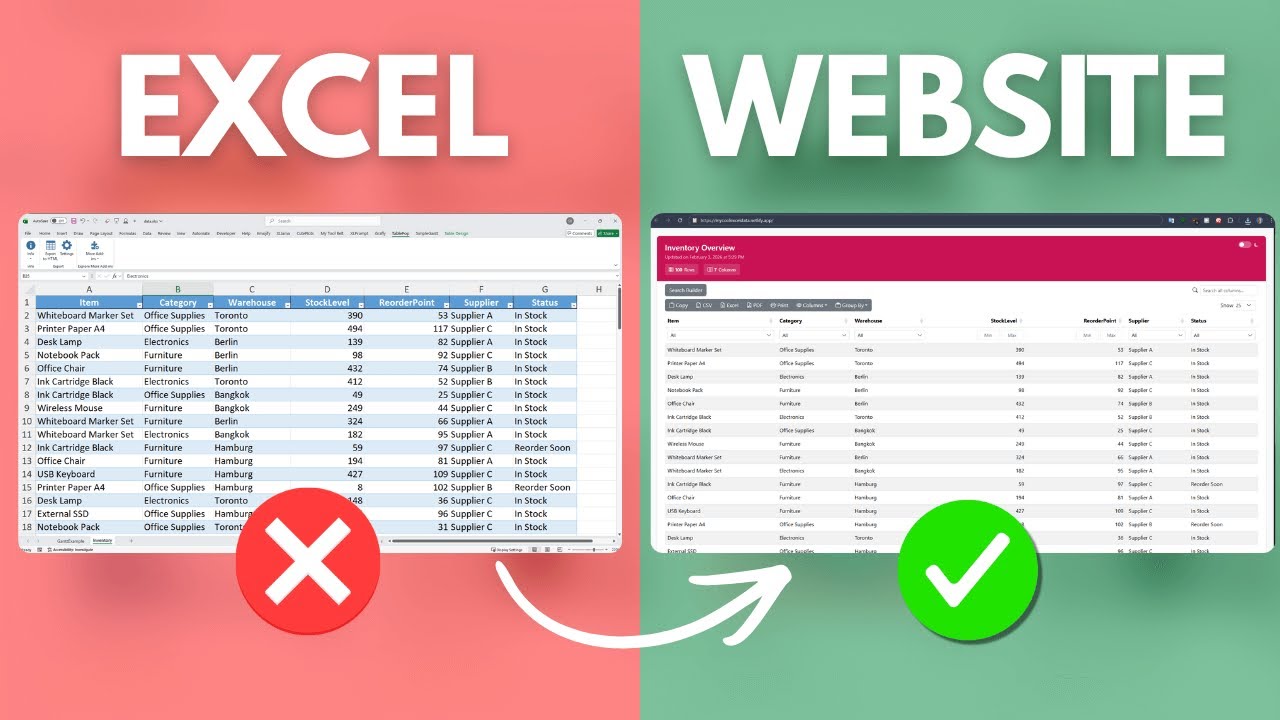
Turn Excel Tables Into Stunning HTML Reports (Free Add-in)
Machine-readable: Markdown · JSON API · Site index
Machine-readable: Markdown · JSON API · Site index


Экстракты и дистилляты из лучших YouTube-каналов — сразу после публикации.
ПодписатьсяЛучшие методички за неделю — каждый понедельник