I Built The Best Dividend Stock Watchlist (Google Sheets & Excel)
7:28

I Built The Best Dividend Stock Watchlist (Google Sheets & Excel)

Dividend Data 17.04.2026 12 076 просмотров 181 лайков

Machine-readable: Markdown · JSON API · Site index

Поделиться Telegram VK Бот
Транскрипт Скачать .md
Анализ с AI
Описание видео
📥 Download Free Template: https://www.dividenddata.com/products/dividend-stock-watchlist-spreadsheet 🚀 Get Live Data in Your Spreadsheet (Free): https://www.dividenddata.com/sign-up-free ───────────────────────────────── 0:00 New Free Dividend Stock Watchlist 0:31 How to Download 0:50 Watchlist Explained 1:32 Yield Target Tracker 2:55 Yield History Analyzer 5:37 Dividend Calendar 6:14 Getting Started 6:34 Download Here (Excel & Google Sheets) ───────────────────────────────── (Google Sheets) Getting Started Video: https://youtu.be/ptYHf8bv8nY (Microsoft Excel) Getting Started Video: https://youtu.be/UWIhj-9FbMQ 
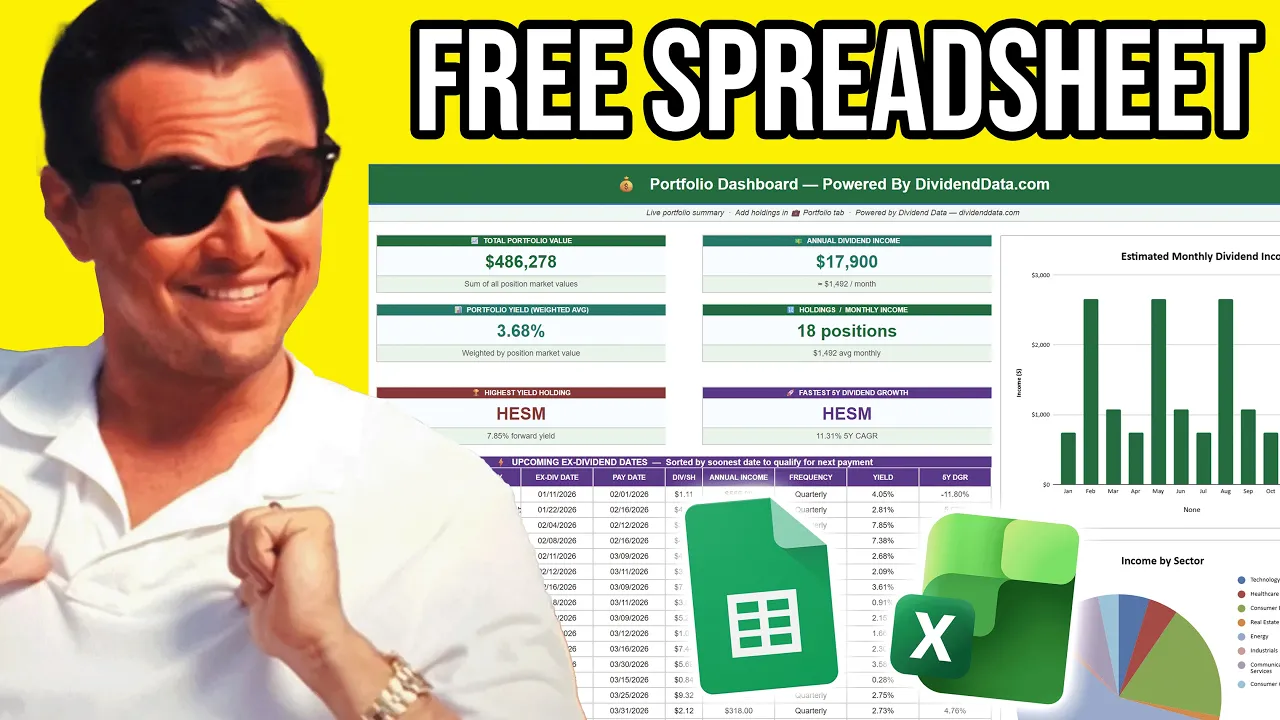
I built a free dividend portfolio tracker that pulls live data automatically — no copy-paste, no manual dividend entry, no workarounds. Track your projected annual dividend income, yield on cost, dividend growth rate, and monthly income projections — all updated automatically using the Dividend Data add-in (free tier available). Works in Google Sheets and Excel. 📥 Download the free template here: https://www.dividenddata.com/products/dividend-stock-watchlist-spreadsheet ───────────────────────────────── My Links: 💻 Dividend Data: https://www.dividenddata.com/ Follow on X: https://x.com/dividend_data Listen on Spotify: https://open.spotify.com/show/4dBCd8IWgBYJgrbI2zROPR?si=084da0648e694103 Follow on Instagram: https://www.instagram.com/dividenddata/ ───────────────────────────────── Dividend Growth Investing creates cash flow without selling your position. Reinvested dividends compound powerfully over time — and tracking them properly is the first step toward financial freedom. Disclaimer: This is my opinion and not financial advice. #dividends #dividendinvesting #portfoliotracker #googlesheets #excel #dividendportfolio #passiveincome #dividendgrowth

Оглавление (8 сегментов)

New Free Dividend Stock Watchlist

If you are manually tracking a watch list of dividend stocks, you are doing it wrong. Keeping up with changing dividend payouts, yields, execution dates, payment dates, dividend growth rates, payout ratios, all of that can be a pain. And if you have a large spreadsheet like this, you'd be copy-pasting and searching. It could take hours to fill out. So, today I'm giving out the best free dividend stock watch list for Google Sheets and Excel. It automatically updates with live market data, and in seconds it gives you the latest data, which would take hours to keep up to date. I put a lot of work

How to Download

into the spreadsheet template, and you can download it for free with the link in the description and pin comment of the video. Many of you already downloaded our dividend portfolio tracker spreadsheet, but that is for your account, and it's focusing on the stocks you actually own in your portfolio, and then forecasting the growth of that portfolio. After making

Watchlist Explained

the portfolio tracker template, I realized we need a more general stock watch list for the stocks you don't own, but are considering adding to your account. And I know I have hundreds of stocks that I like to follow and keep up with their latest data. As an example right here, I pre-filled this with a list of all of the dividend aristocrat and dividend kings. And this by itself is fantastic. It shows you the payment dates, the one-year dividend growth rate, the three-year dividend growth rate, five-year and ten-year, the payout ratio, and the free cash flow based payout ratio, as well as the forward-looking dividend, the forward-looking dividend yield, and then the trailing dividend and trailing dividend yield, and the next payout. And this all automatically updates in seconds. As an example, I'll come over here and hit refresh. And you will see that the data starts populating in. But

Yield Target Tracker

that wasn't enough, because I wanted something that would actually track how you know when something's a buy. Many dividend investors, they like to target specific yields for any stock. So, the second tab on the spreadsheet is a yield target tracker. And basically how this works is you have your list of stocks that pre-fills from the other tab, and you can enter in a yield, like say the Altria Group. That's a stock I own, ticker symbol MO. Let's say I want to target a 7% dividend yield. You enter that in and it highlights not yet. That's because the stock is currently trading below your target yield. However, what if your target yield was 6%? Then it would instantly be highlighted a buy and the whole row turns green. And if it was 5%, it would be labeled a super buy. And for this stock, if you had it 6. 75, it would highlight yellow at getting close. So, if you have your target yields set for all of these different companies, then it would instantly notify you when something's getting close to a buy. And I know this is how a lot of dividend investors operate, so I think this is a game-changer tool. And again, this works in both Google Sheets and Excel. It's powered by our dividend data add-ins. So, here you can see an example of what I was building here. These are some of the stocks I cover on the channel, HESM and MPLX. I target around an 8% dividend yield on those and HESM just crossed over into the buy territory. And MPLX, it's getting close. But that's my personal subjective target. This next feature of this spreadsheet that I'm

Yield History Analyzer

going to show you, it's called the yield history tab and this is extremely powerful. I designed this at the personal request of my dad who is a dividend investor. If you watched my recent interview, I talked a little bit about how he got me into investing. And with his dividend investing strategy, he likes to try and target buying stocks in the 90th percentile dividend yield or above. So, based over the past five or 10 years of how the stock has traded, he tries to optimize his entry point in dividend yield on the subset of stocks that he follows. So, I built a dividend yield analyzer. So, we can enter a stock, let's say PepsiCo. It loads in with the latest data and you can see the full spectrum of their dividend yield over time. This spreadsheet uses five years of data, so you can see the minimum yield all the way up to the maximum yield that it's traded in that time, as well as the 10th percentile, 20th percentile, the median, the 75th percentile, the 90th percentile and the max. Actually, I should have been highlighting this part. You can see it right here. So, based on this, it will give you a recommended fair value or deep value or expensive rating on the stock in terms of the dividend yield. So, with this, all you have to do is enter your ticker and it will give you a suggestion and ideas around what a good target yield even is. If we scroll down, this is a part that I really liked, which are two charts I'm about to show you. We have the 5-year dividend yield history of the stock. So, you can see the daily change in dividend yield based on the price and dividend increases and everything happening. And you can see the range it has traded at in that time. We have it pre-filled with the 10th percentile and the 90th percentile. And you can also see where you are today. So, with the example of Pepsico, anything above 4% is historically high. Also, at the request of my dad, I'm building custom features over here. We have the yield distribution histogram. And this displays how often over the past 5 years a company has been trading at that yield. So, you can see with Pepsico, they most of the time they're trading under 3 and 1/2%. And you can see it's an outlier significantly whenever they trade above 4%. And it will highlight the column for the current yield it's currently trading at. And the cool thing about this tool is that it automatically updates. All you have to do is put in the new ticker, let it load in, it happens in like a second. As an example, we have ADP, which is currently showing deep value. It's trading at the 97th percentile of historic dividend yield right now. You can see it nearly 3 and 1/2% that's historically high. And this is a stock where the median is 2. 8%. And you can see today it's still an outlier in the upper bound of dividend yield. So, let me recap. Dividend watchlist, a yield target tracker, a yield history analyzer, so you can find what your target yield should be. And we

Dividend Calendar

have another tab here, which is the annual dividend calendar. So, for all the stocks on your watchlist, you can see what the upcoming execution dates and payment dates are for their latest declared dividend at that time. And you can update all of this data by just hitting refresh, and it will instantly update with the latest information. Back to the Google Sheets version here where I had all the dividend aristocrats and kings loaded in. If you follow all these stocks, this can be incredibly useful. And I knew after I made the portfolio tracker template, I had to make a dividend watch list template. And this really is the ultimate dividend stock watch list. And again, you can download

Getting Started

this all with the link in the description and pin comment of the video. And when you get it, all you have to do is in column A, over here on the left, you just need to enter the ticker symbols. So, as an example, I'll put in Microsoft, and then you'll see Microsoft stock that will start to load in. And going back to the full list, it's literally that simple. All you have to do is enter the ticker symbols. And the

Download Here (Excel & Google Sheets)

reason this all works is because it's powered by the dividend data spreadsheet add-in. It works for both Google Sheets and Microsoft Excel. And the whole premise is that we have our stock data, and we automatically bring it into your spreadsheet. There's custom functions where you can build and customize it fully yourself, however you want. And you can get really deep with it. That's how I build these templates. And the reason why I'm making these templates is because it shows you what can be done with the tool. They're also very useful. And if you head over to dividenddata. com and click templates, you can see we already have one out. This is going to be the second one that comes out. And there's going to be a catalog of templates over time. And the only thing you need to do after you install the template is download our spreadsheet add-in. It's available for Google Sheets and Microsoft Excel. And if you just head over to dividenddata. com and enter in your email, you'll get our full onboarding as well as video tutorials of how to use the add-in. So, with that said, thanks for watching and happy investing. I'll see you in the next video.

Другие видео автора — Dividend Data

Ctrl+V

Экстракт Знаний в Telegram

Экстракты и дистилляты из лучших YouTube-каналов — сразу после публикации.

Подписаться

Дайджест Экстрактов

Лучшие методички за неделю — каждый понедельник